Using Xdebug with Lando, Laravel, and PHPStorm
Introduction
Following in the footsteps of my colleagues, I learned to use var_dump, print_r, and exit() to print information about my PHP variables and stop my code execution. A little over 3 years ago, I first experienced Chrome’s Devtools JS debugger. When I understood that I could view the data in all variables in memory at the paused point of code execution, I knew there had to be a better way for other development workflows than just JS debugging in browser. Upon searching, I came across Xdebug.
Early on, a working Xdebug set up constantly eluded me. I had issues with the local server setup. I had issues with my IDE set up. At some point, I decided to pay my way out of the IDE set up by paying for PHPStorm. I had read about their zero config Xdebug set up, and gave it a shot. While PHPStorm did give me a leg up, I still found that only time, repetition, and review of the documentation would truly get me to the promised land.
Fast forward to present times: I still find myself explaining to my colleagues what value a good debugger can provide. Too often, I hear that the set up is hard, and that a quick var_dump is good enough. With that, I had my first blog idea. This post will be a tutorial in how to set up Lando (a Docker abstraction) PHPStorm, and a default Laravel app. Future posts will explore other IDEs, Xdebug functionality, and quirks of debugging some features on various PHP frameworks.
Setup
Guide expects user already has the lando cli installed
Move into your preferred projects working directory, create a project directory, enter it, and initialize a lando project.
mkdir laravel
cd laravel
lando init -r laravel
Update .lando.yml
name: my-lando-app
recipe: laravel
config:
  xdebug: true
  webroot: ./my-app/public
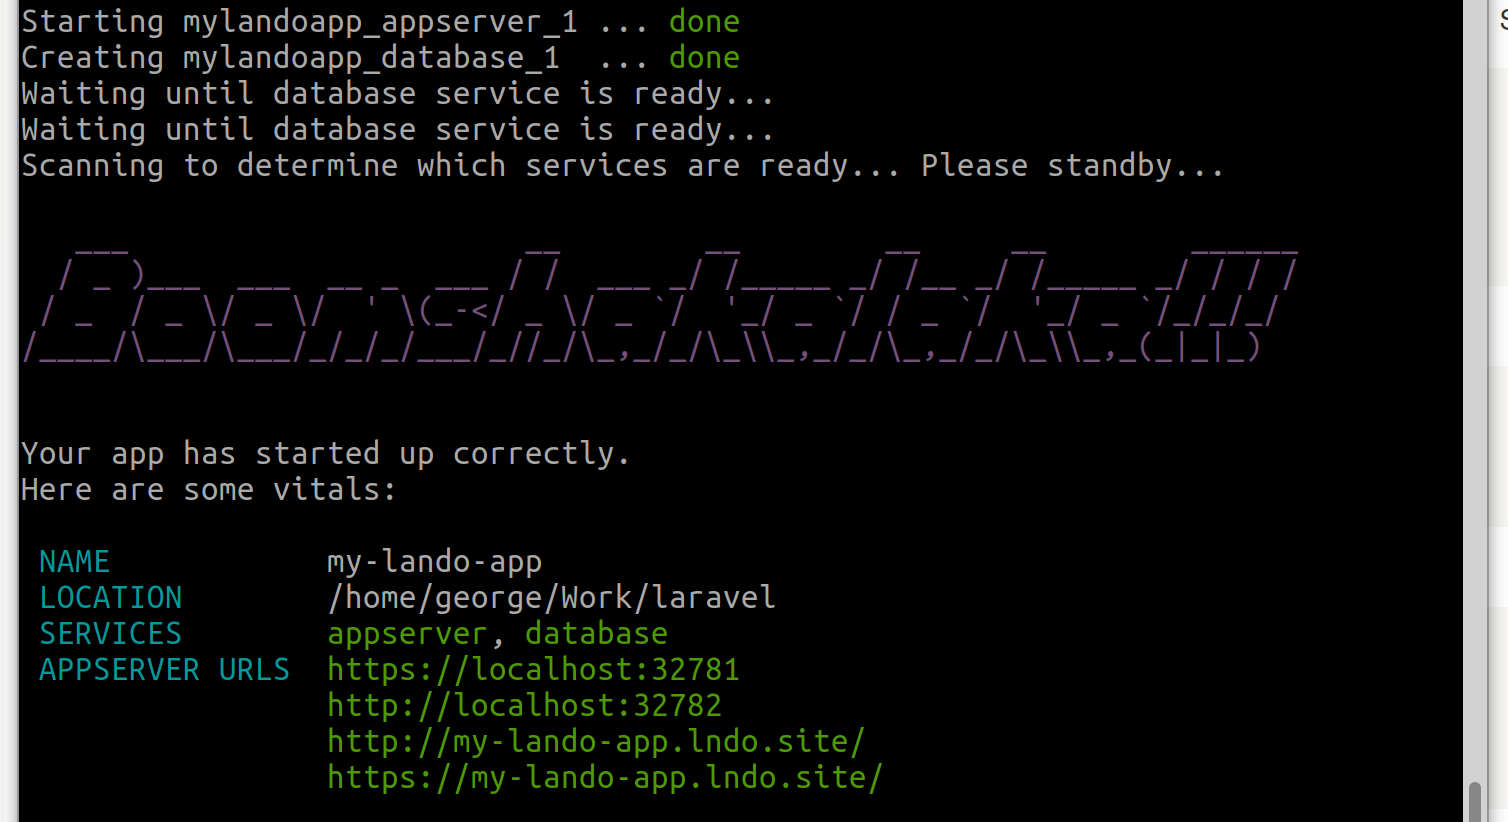
Start lando app
lando start
SSH into the lando instance and create laravel app
lando ssh
laravel new my-app
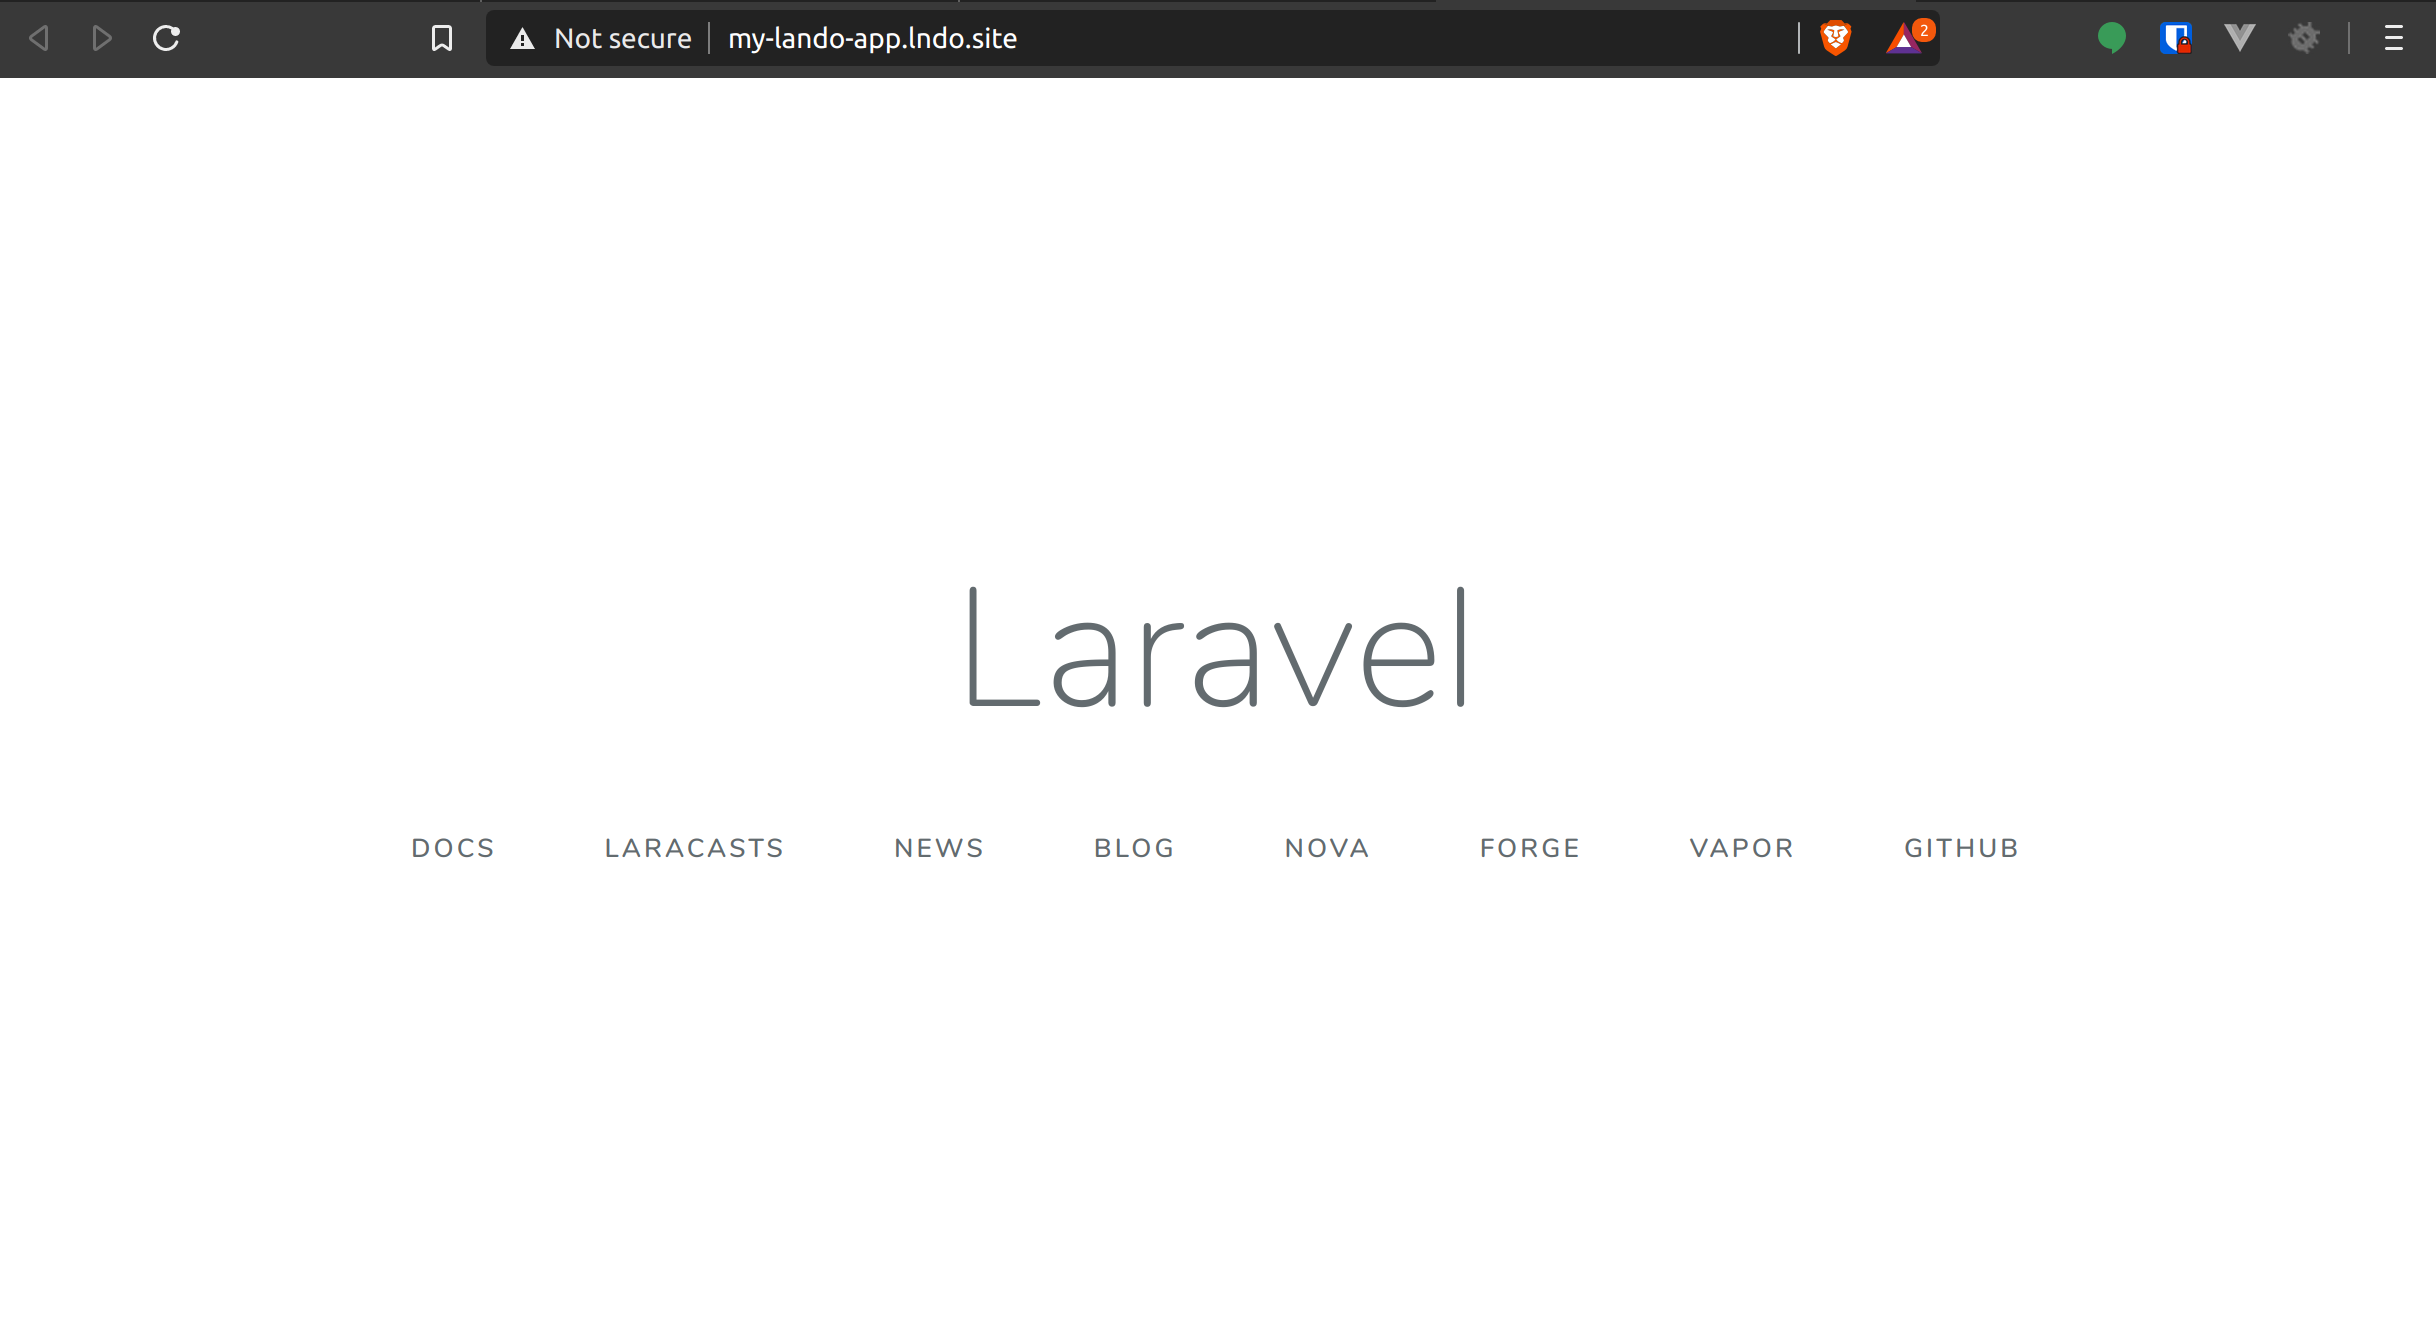
Browse to https://my-lando-app.lndo.site/
Xdebug Browser Extensions
Install the browser extension for the applicable
https://addons.mozilla.org/en-US/firefox/addon/xdebug-helper-for-firefox/
https://chrome.google.com/webstore/detail/xdebug-helper/eadndfjplgieldjbigjakmdgkmoaaaoc
PHPStorm Set Up
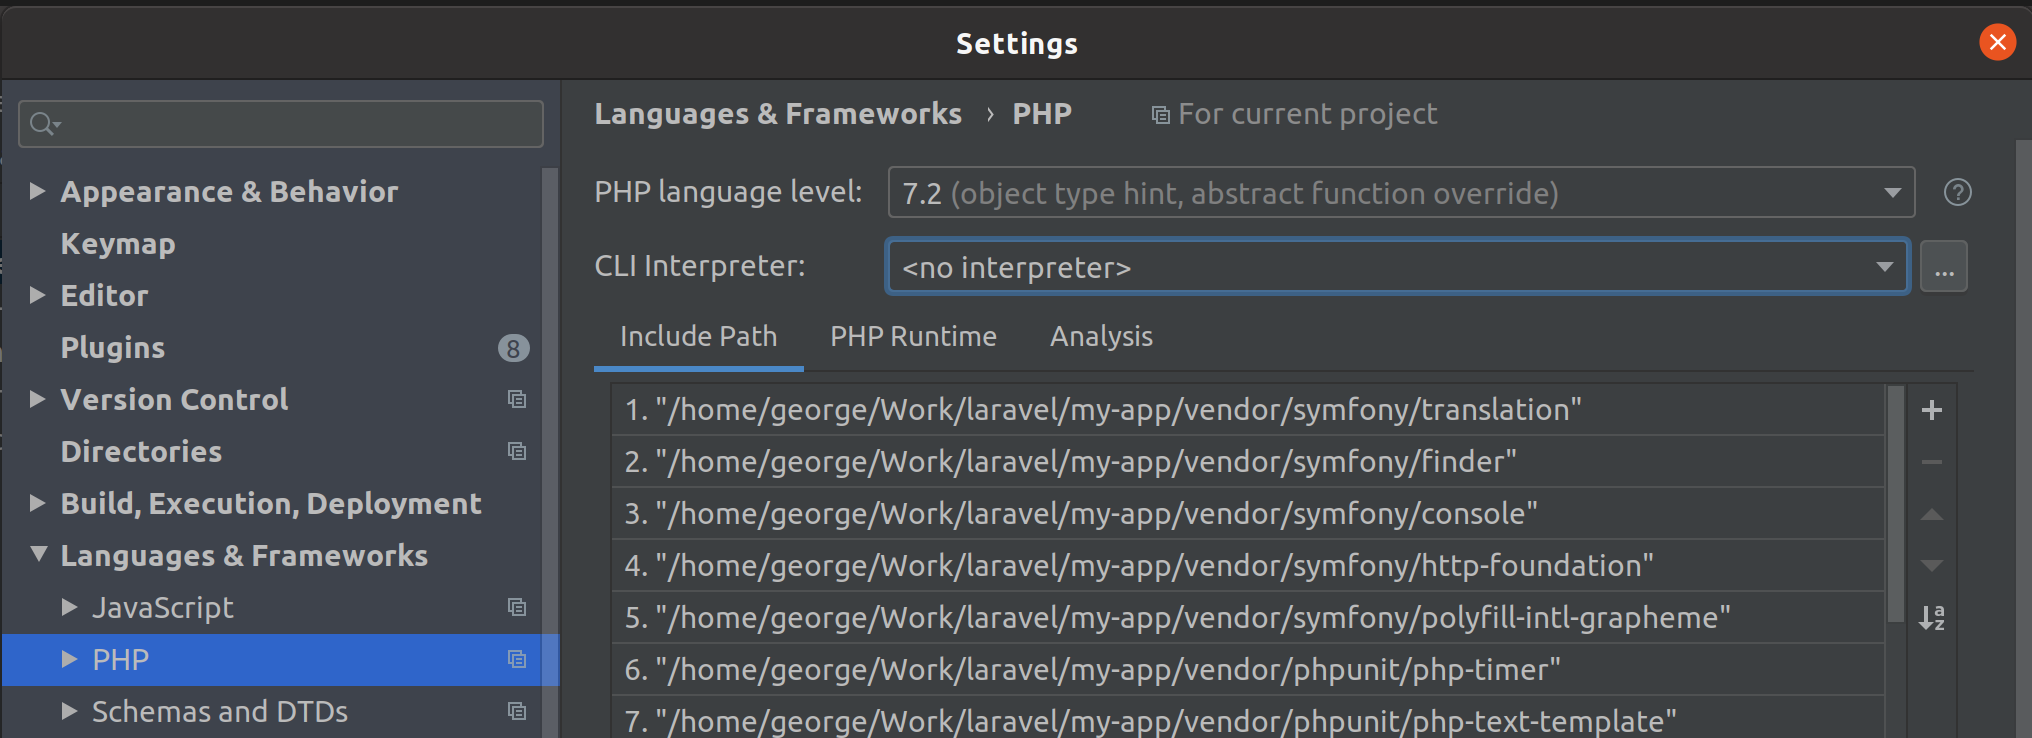
File → Settings → Languages & Frameworks → PHP
Click the “…” menu button at the end of the CLI Interpreter selection.
Click the “+” button in the left pane
Select “From Docker…”
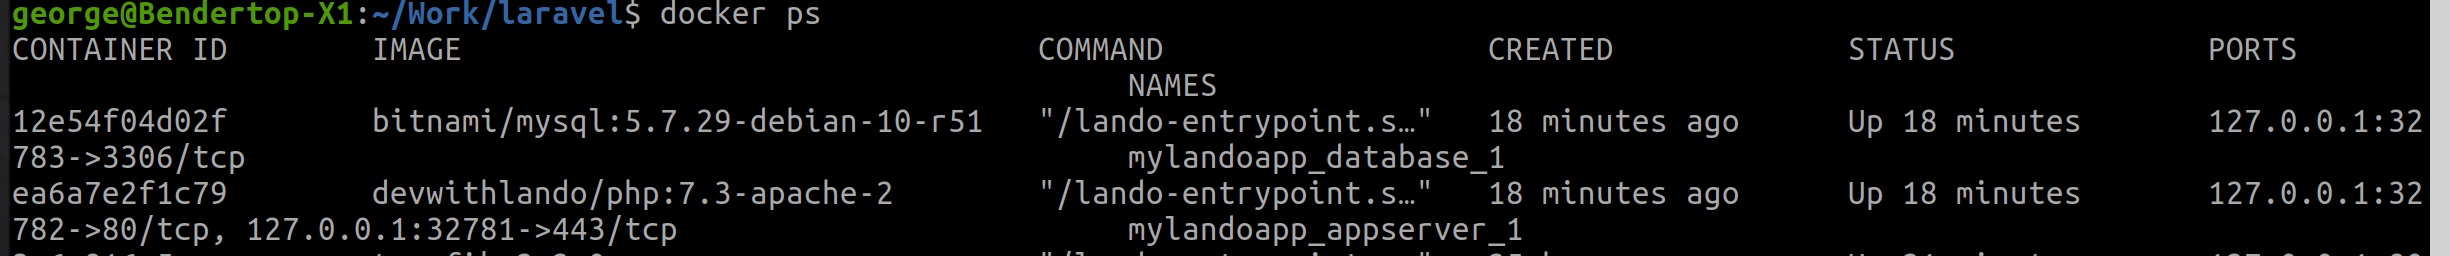
Confirm the name of your lando appserver image by running
docker ps
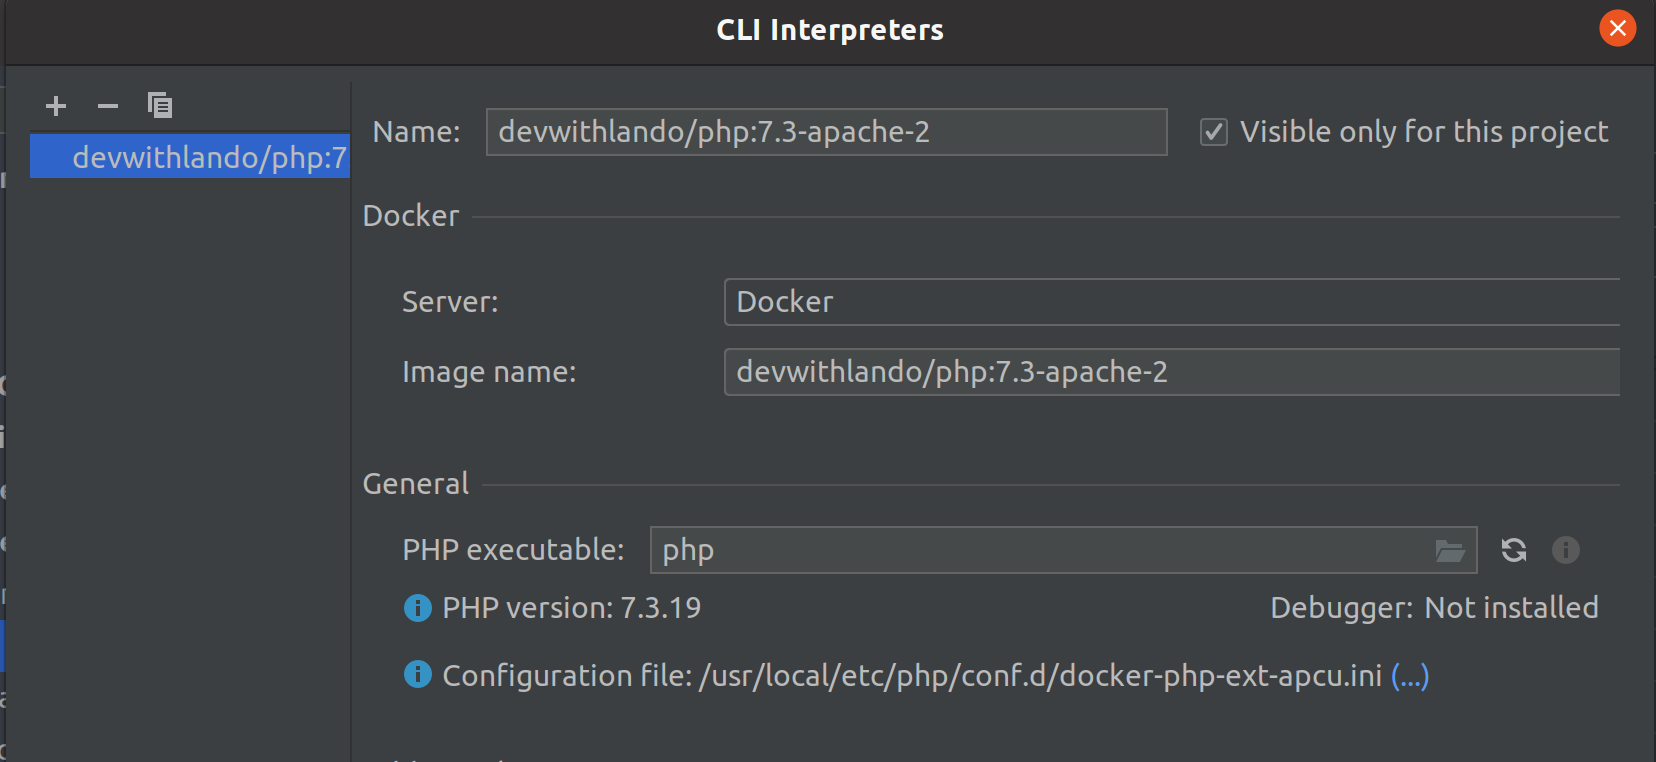
In my case, the image name is devwithlando/php:7.3-apache-2
Select the Docker radio button in the “Configure Remote PHP Interpreter” window, and then select the image name from the drop down.
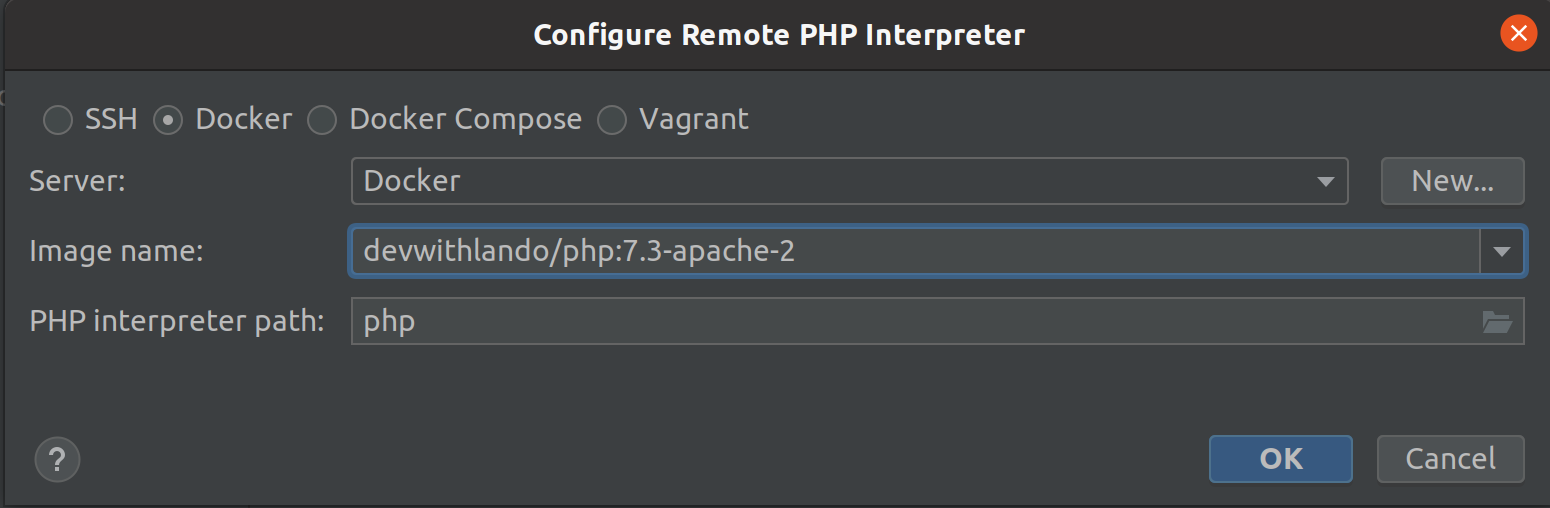
Hit “OK” and then we should see a new Remote Interpreter set up.
Hit “Apply” and “OK” and then the same combo again on the next Settings view.
From the Tool Bar, select Run → Start Listening for PHP Debug Connections
If you are using the default toolbar set up, you should see the following icons.

From your browser tab with the Laravel demo page open, update your xdebug helper to be enabled.
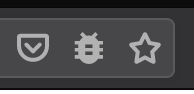
Firefox Disabled
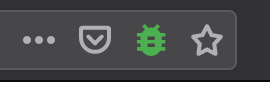
Firefox Enabled
Refresh the laravel demo app, and PHPStorm should trigger a prompt for an Incoming Connection from Xdebug.
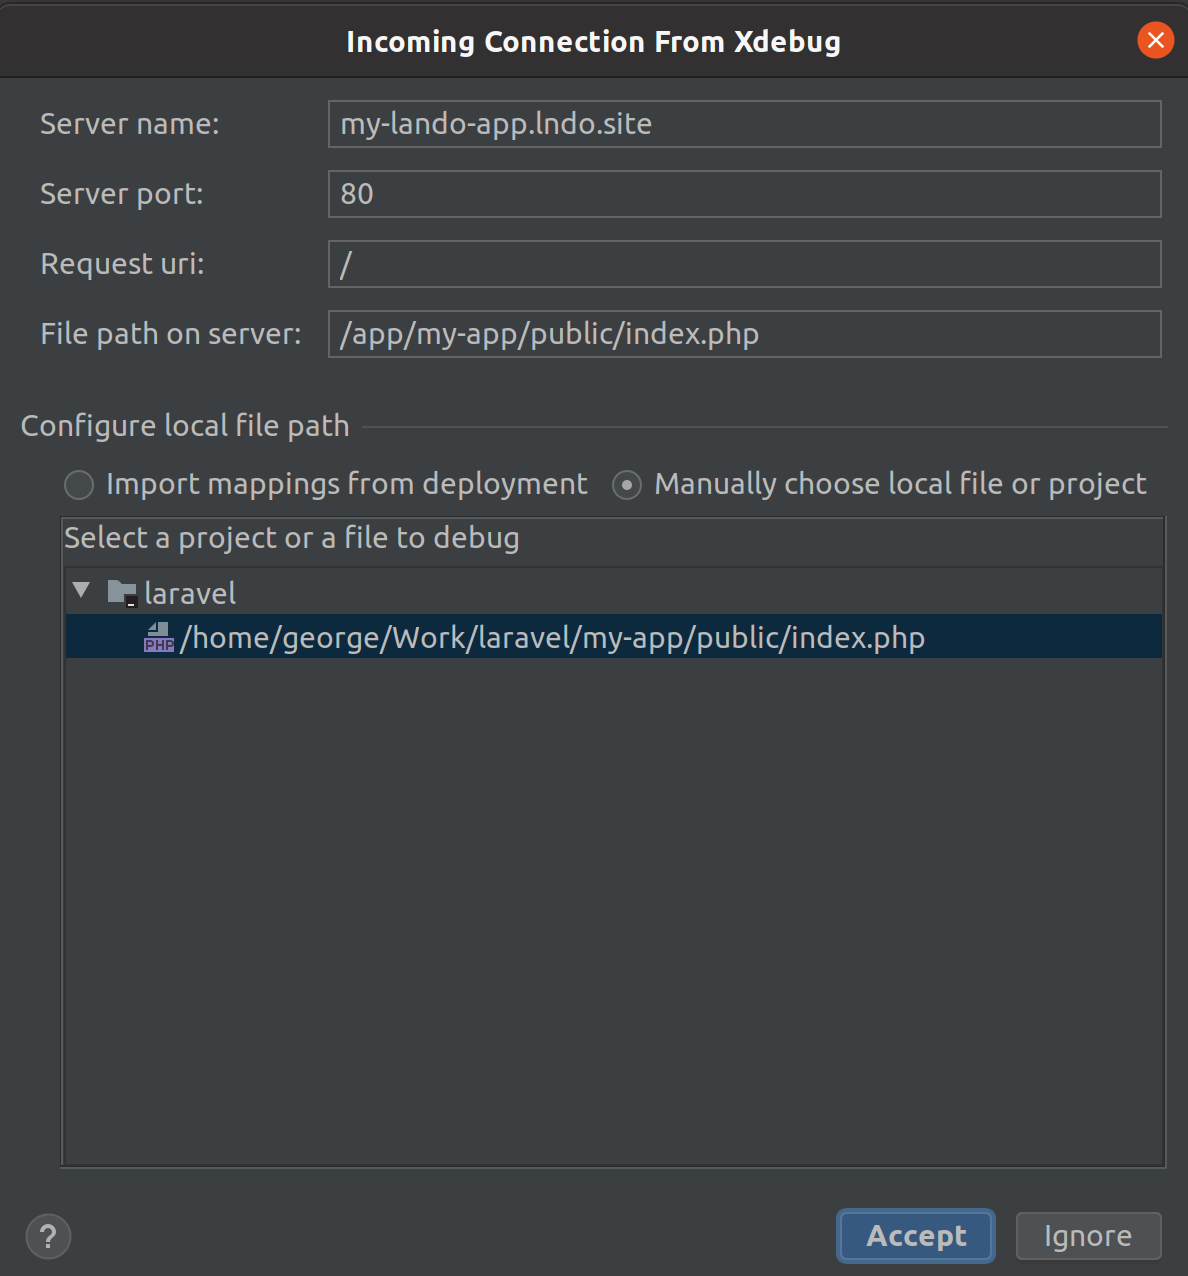
Leave all options as is, and select Accept.
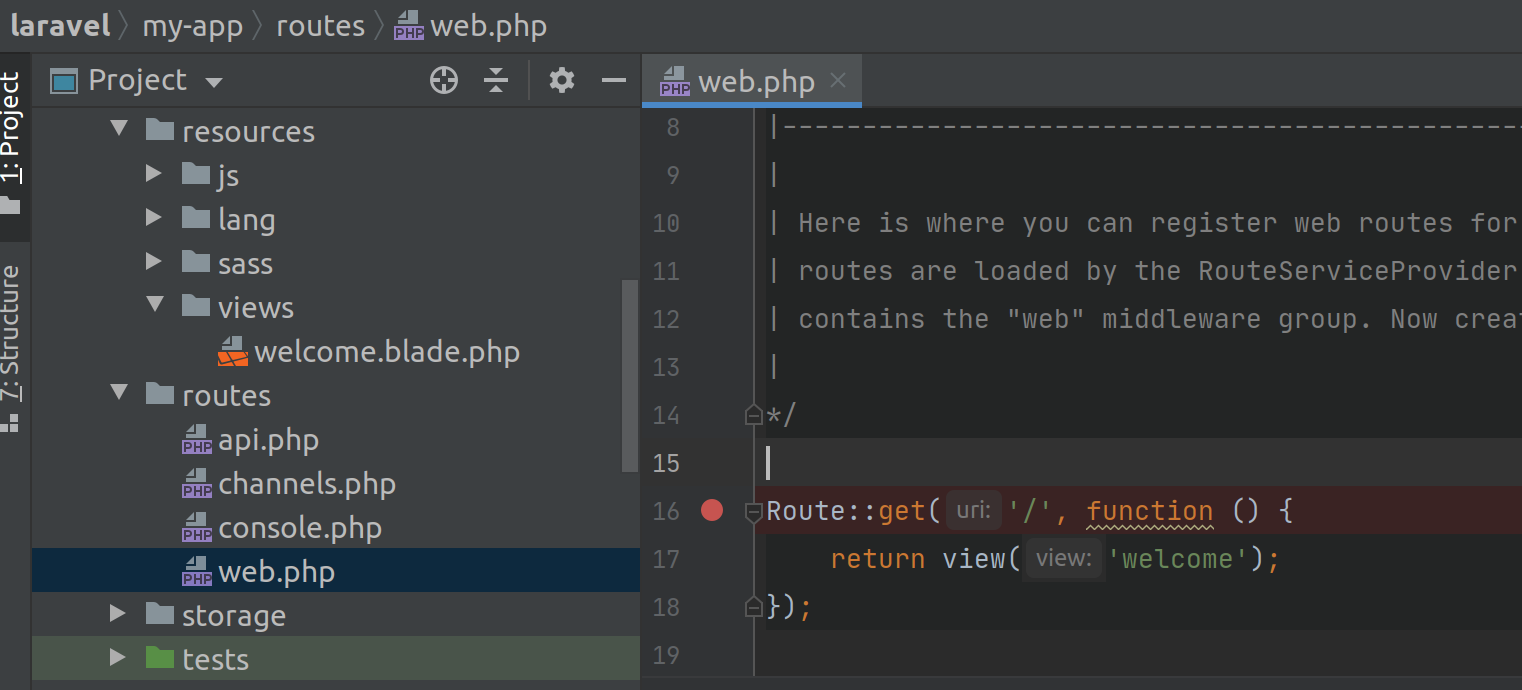
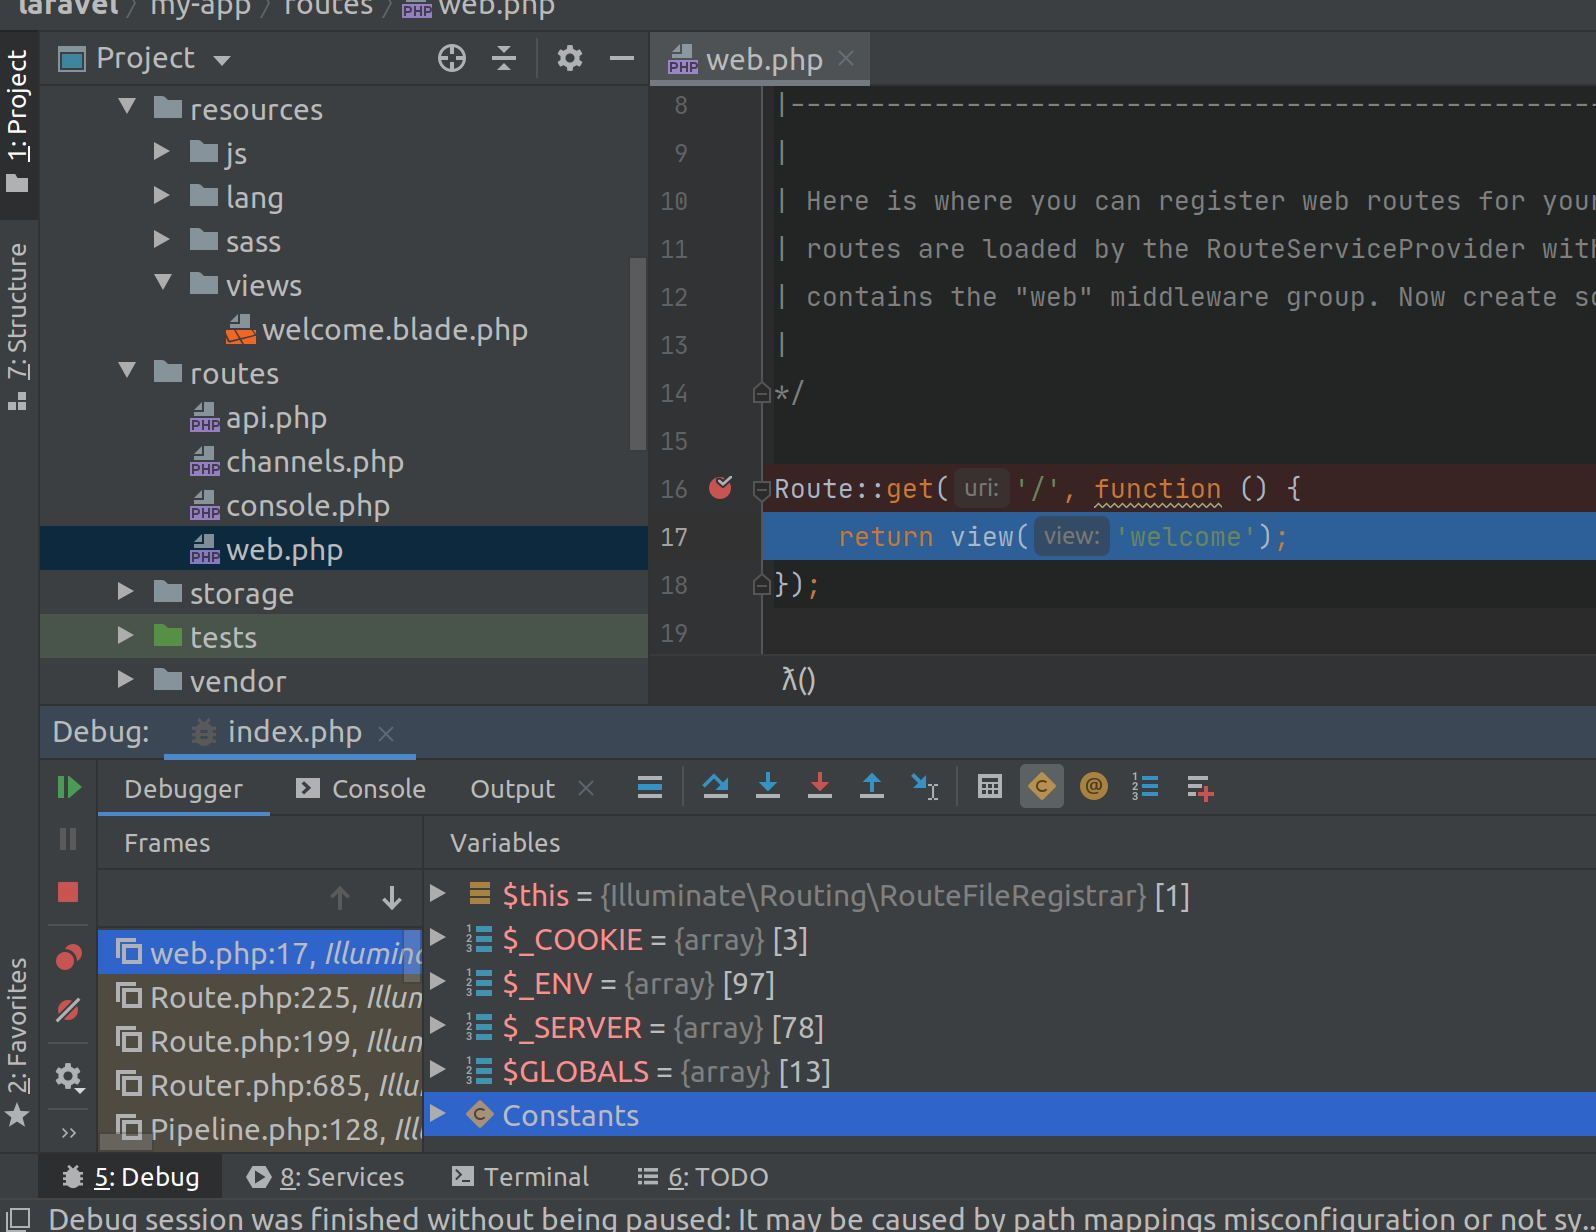
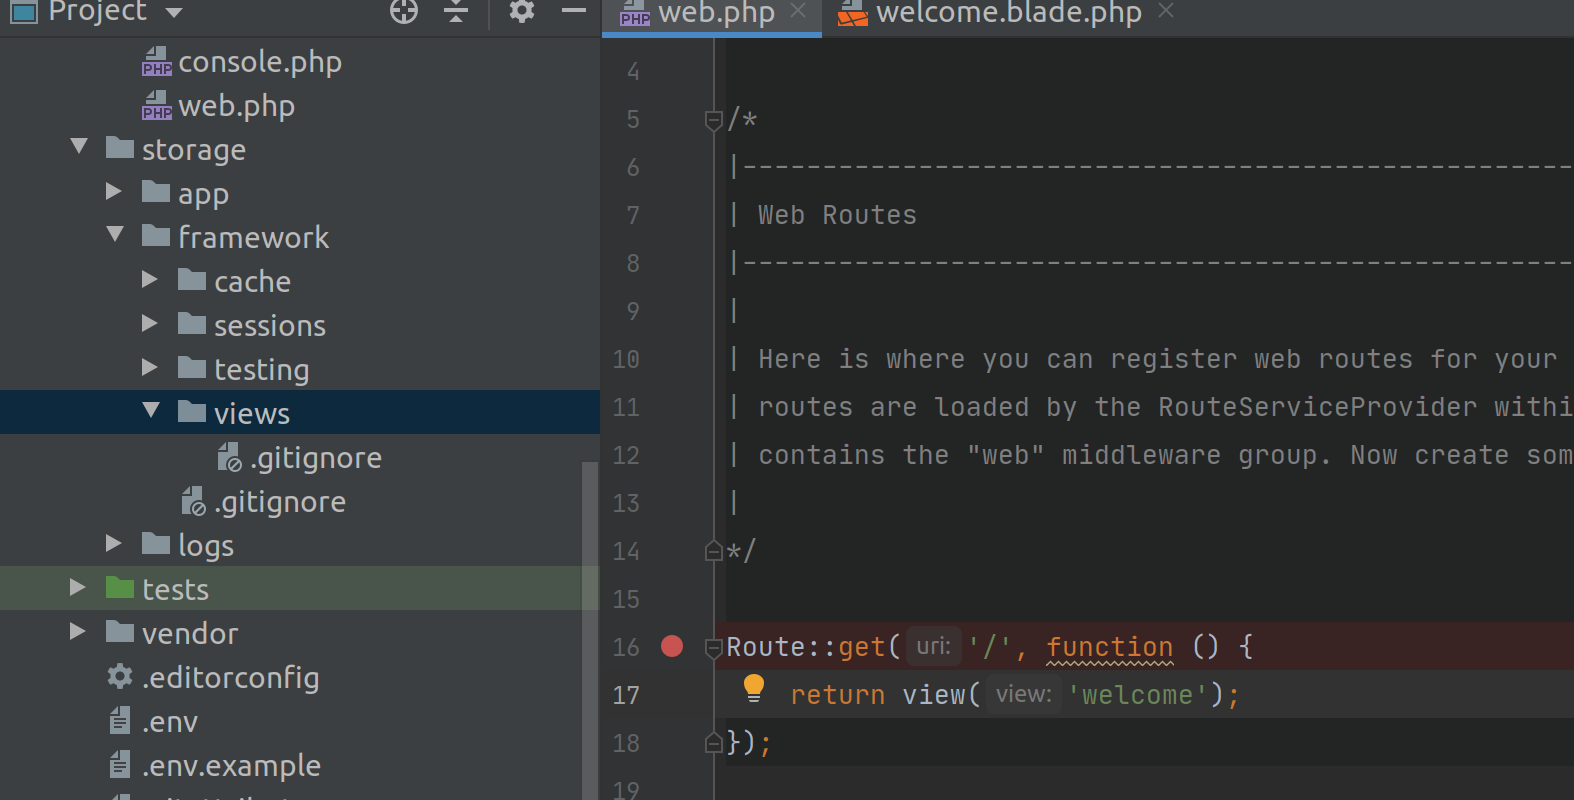
Open the file routes/web.php and click to the left of the root route by the line number. This should put a red dot indicating that a breakpoint is set, and code execution should pause here.
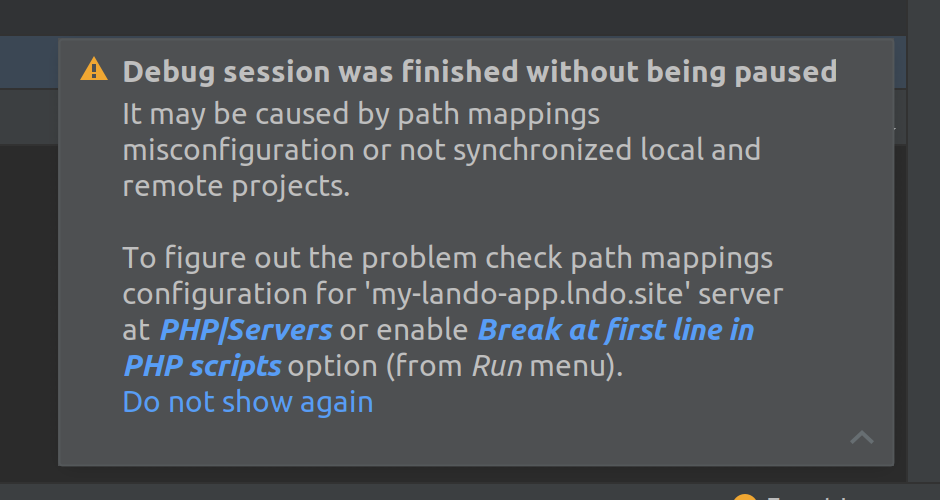
When you reload the page again, you will likely get a warning from PHPStorm that the debug sessions finished without pausing. This is generally an issue with the path mappings, as the warning says.
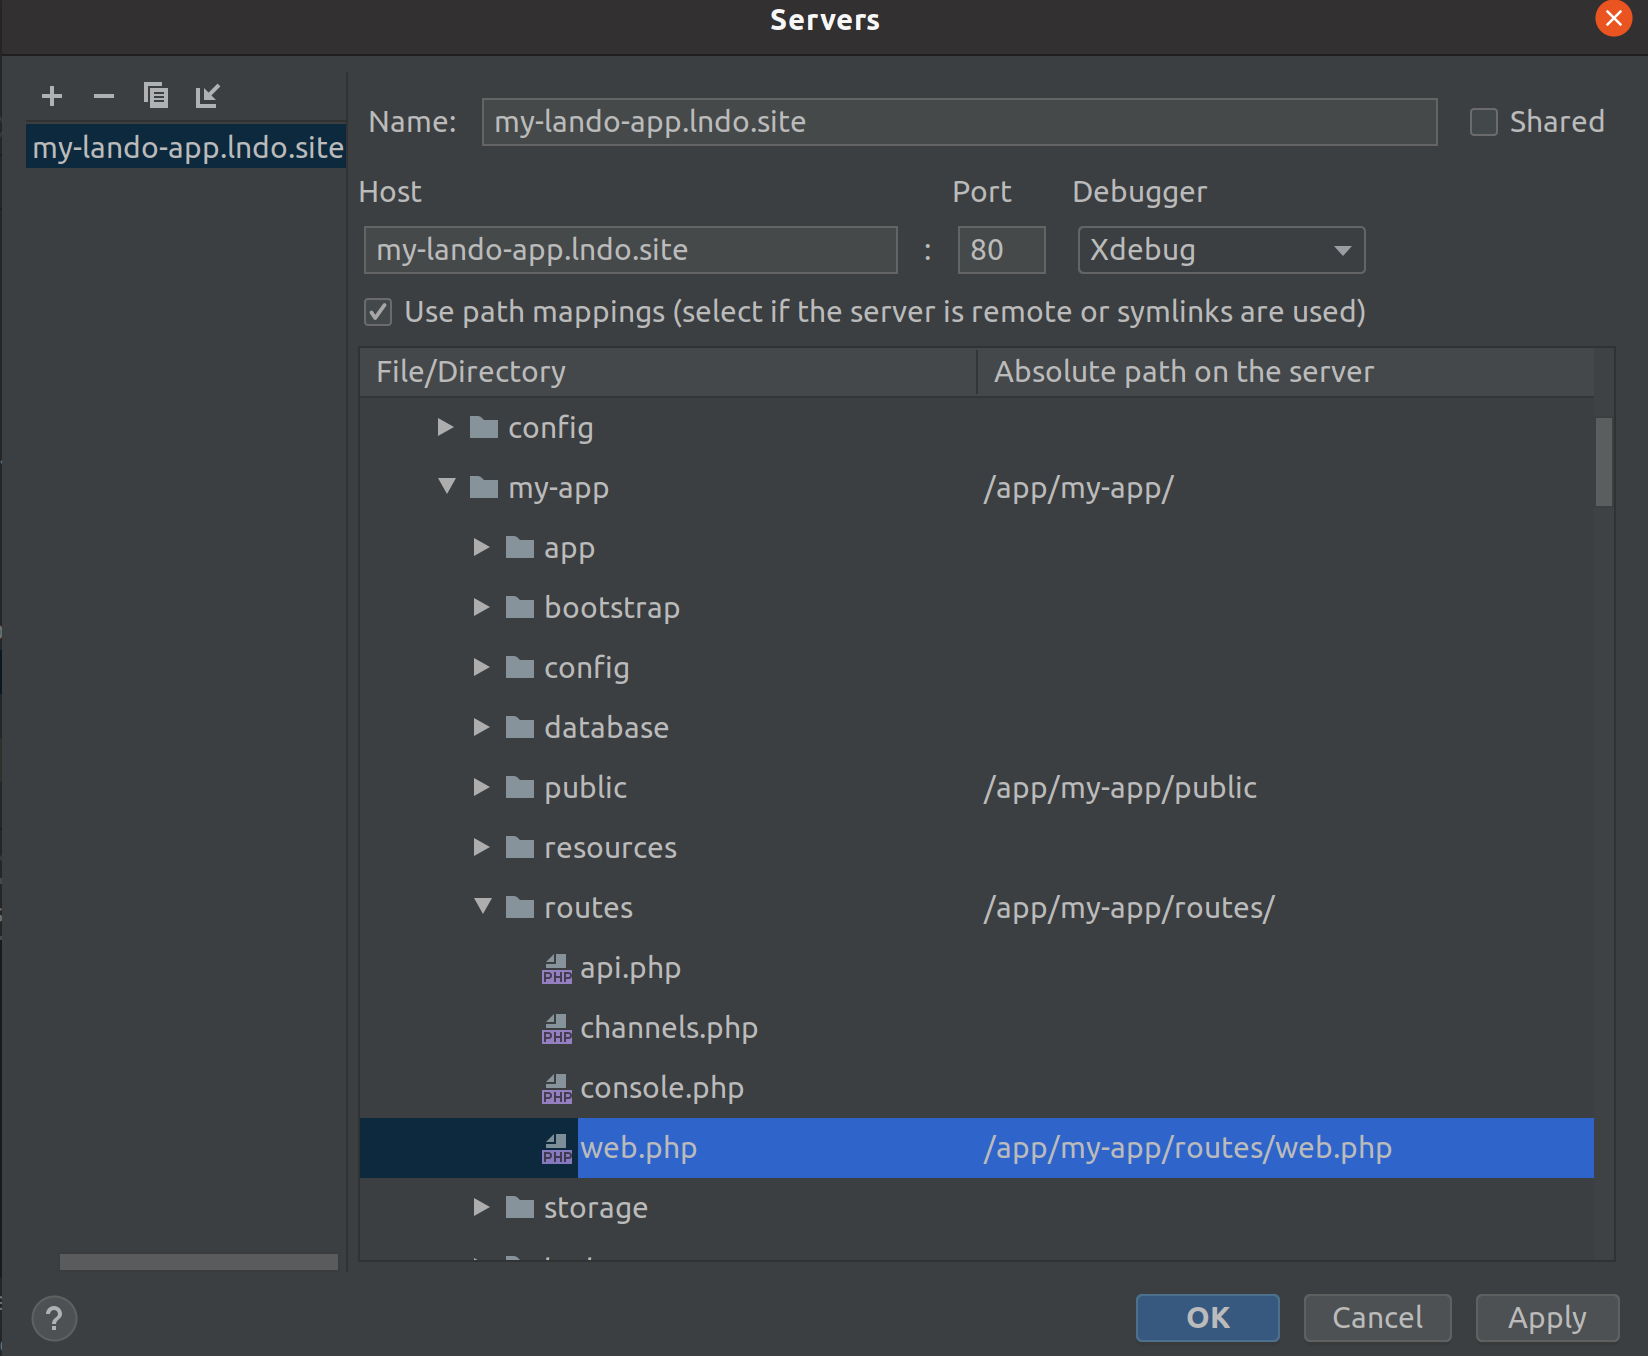
| Click PHP | Servers link in the warning, and it will bring you to the path mappings for the server that was created when the incoming debug request was accepted. I generally make sure that if the request is not pausing, that all absolute path maps are set up at each directory level and the file that I’m trying to debug. |
Once applied, reload the page again.
Debugging Laravel Views
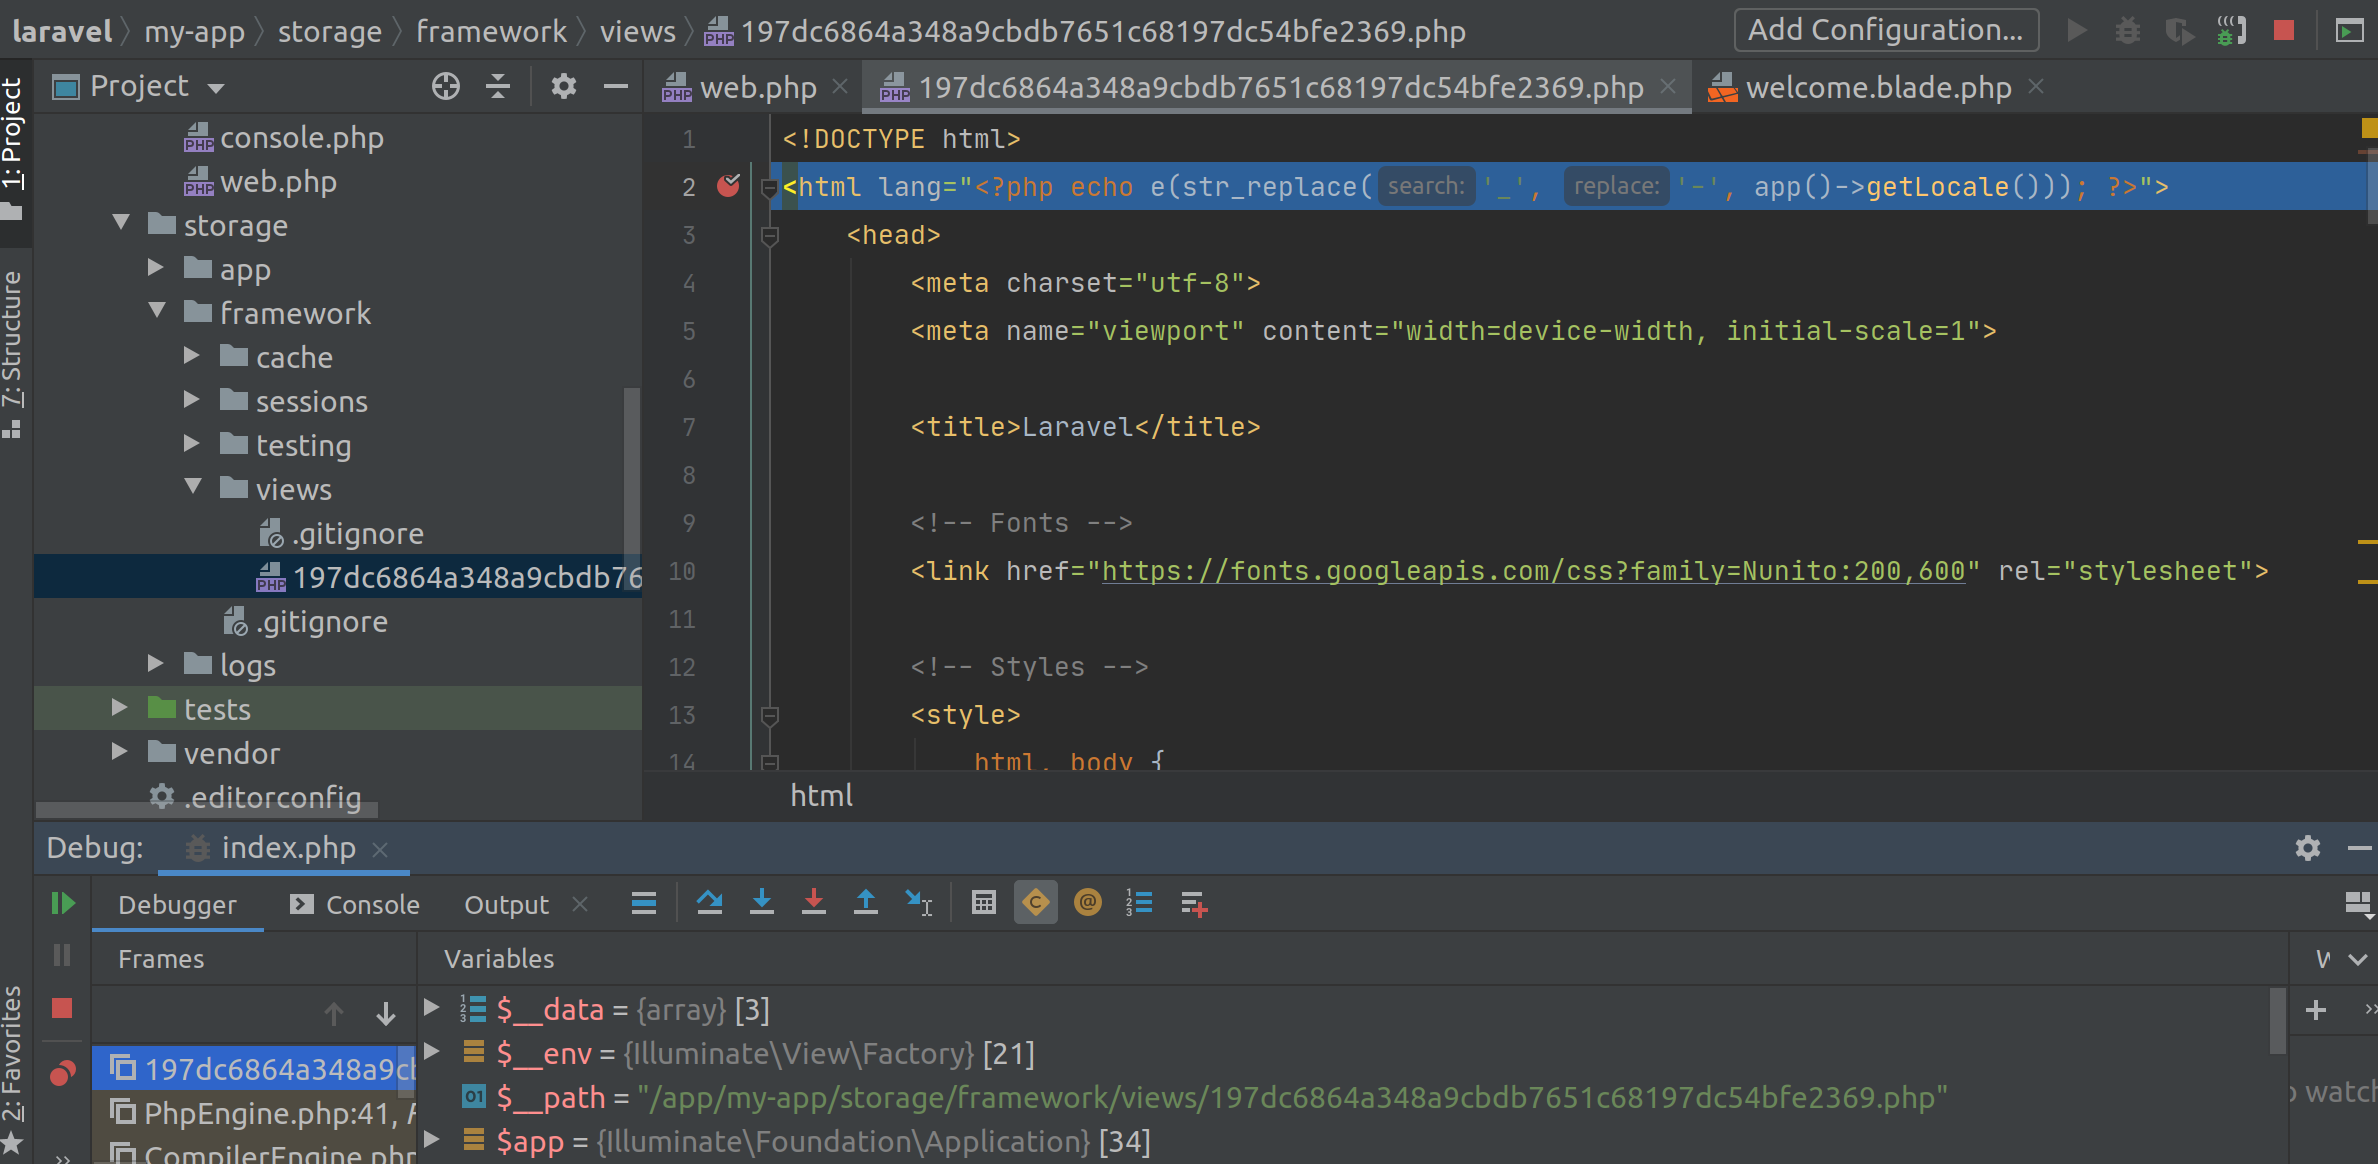
Debugging views requires setting breakpoints in the appropriate compiled template for the view found in storage → framework → views
No compiled views yet
Load the page, and a compiled file should be output. You can then set breakpoints in the compiled file to pause execution when the view is loaded.
If you have a large number of compiled files, you can do the following to clear your compiled views, or just manually delete the files
lando ssh
cd my-app
php artisan view:clear
CLI may already trigger debug events to PHPStorm. You may need to stop the listener to proceed with commands that you don’t want to debug.
Once cleared, you can reload the view, and then the only compiled file should be the one you need.
CLI Debugging
php artisan make:command MyAppCommand
Let’s edit the signature for our reference.
protected $signature = 'my-app:do-it';
Let’s update the handle method to execute code to pause.
public function handle()
{
    echo 'We did a thing!';
}
Update .lando.yml
name: my-lando-app
recipe: laravel
env_file:
  - .env
config:
  xdebug: true
  webroot: ./my-app/public
Add the .env file at the root of the project. Add to it the following. The serverName should match the server created in the PHP settings when you accepted your first debugger connection.
PHP_IDE_CONFIG="serverName=my-lando-app.lndo.site"
Notes:
If you rebuild your lando containers, and the execution pauses, an Xdebug session may have been triggered. Play through
Changes to a .env file being loaded into Lando will require a lando rebuild -y
Dumping out php -i at the command line is not the same as using a phpinfo() in a .php file. command line will load the cli .ini settings, while the values returned by phpinfo() will be the apache or php-fpm settings.