Using Xdebug with Lando, Laravel, and VSCode
Introduction
With my first post, I showcased how to set up Xdebug using Lando for a development environment, and PHPStorm as an IDE. For this post, we will build on the Lando setup, and configure VSCode for our debugging.
Setup
Open up your existing project in VSCode.
Click the debug icon and click Create a launch.json file.
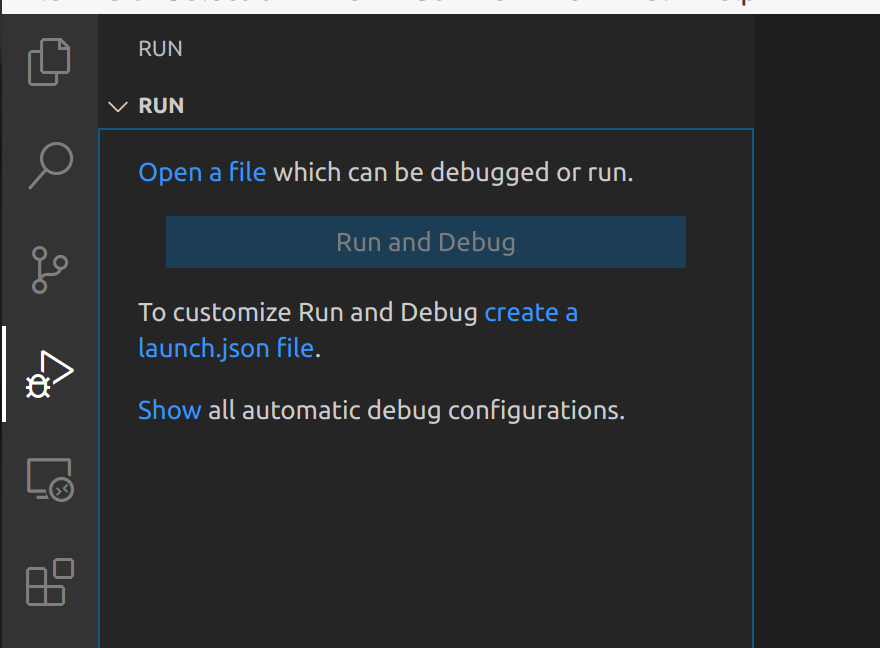
Select More.. from the menu that appears.
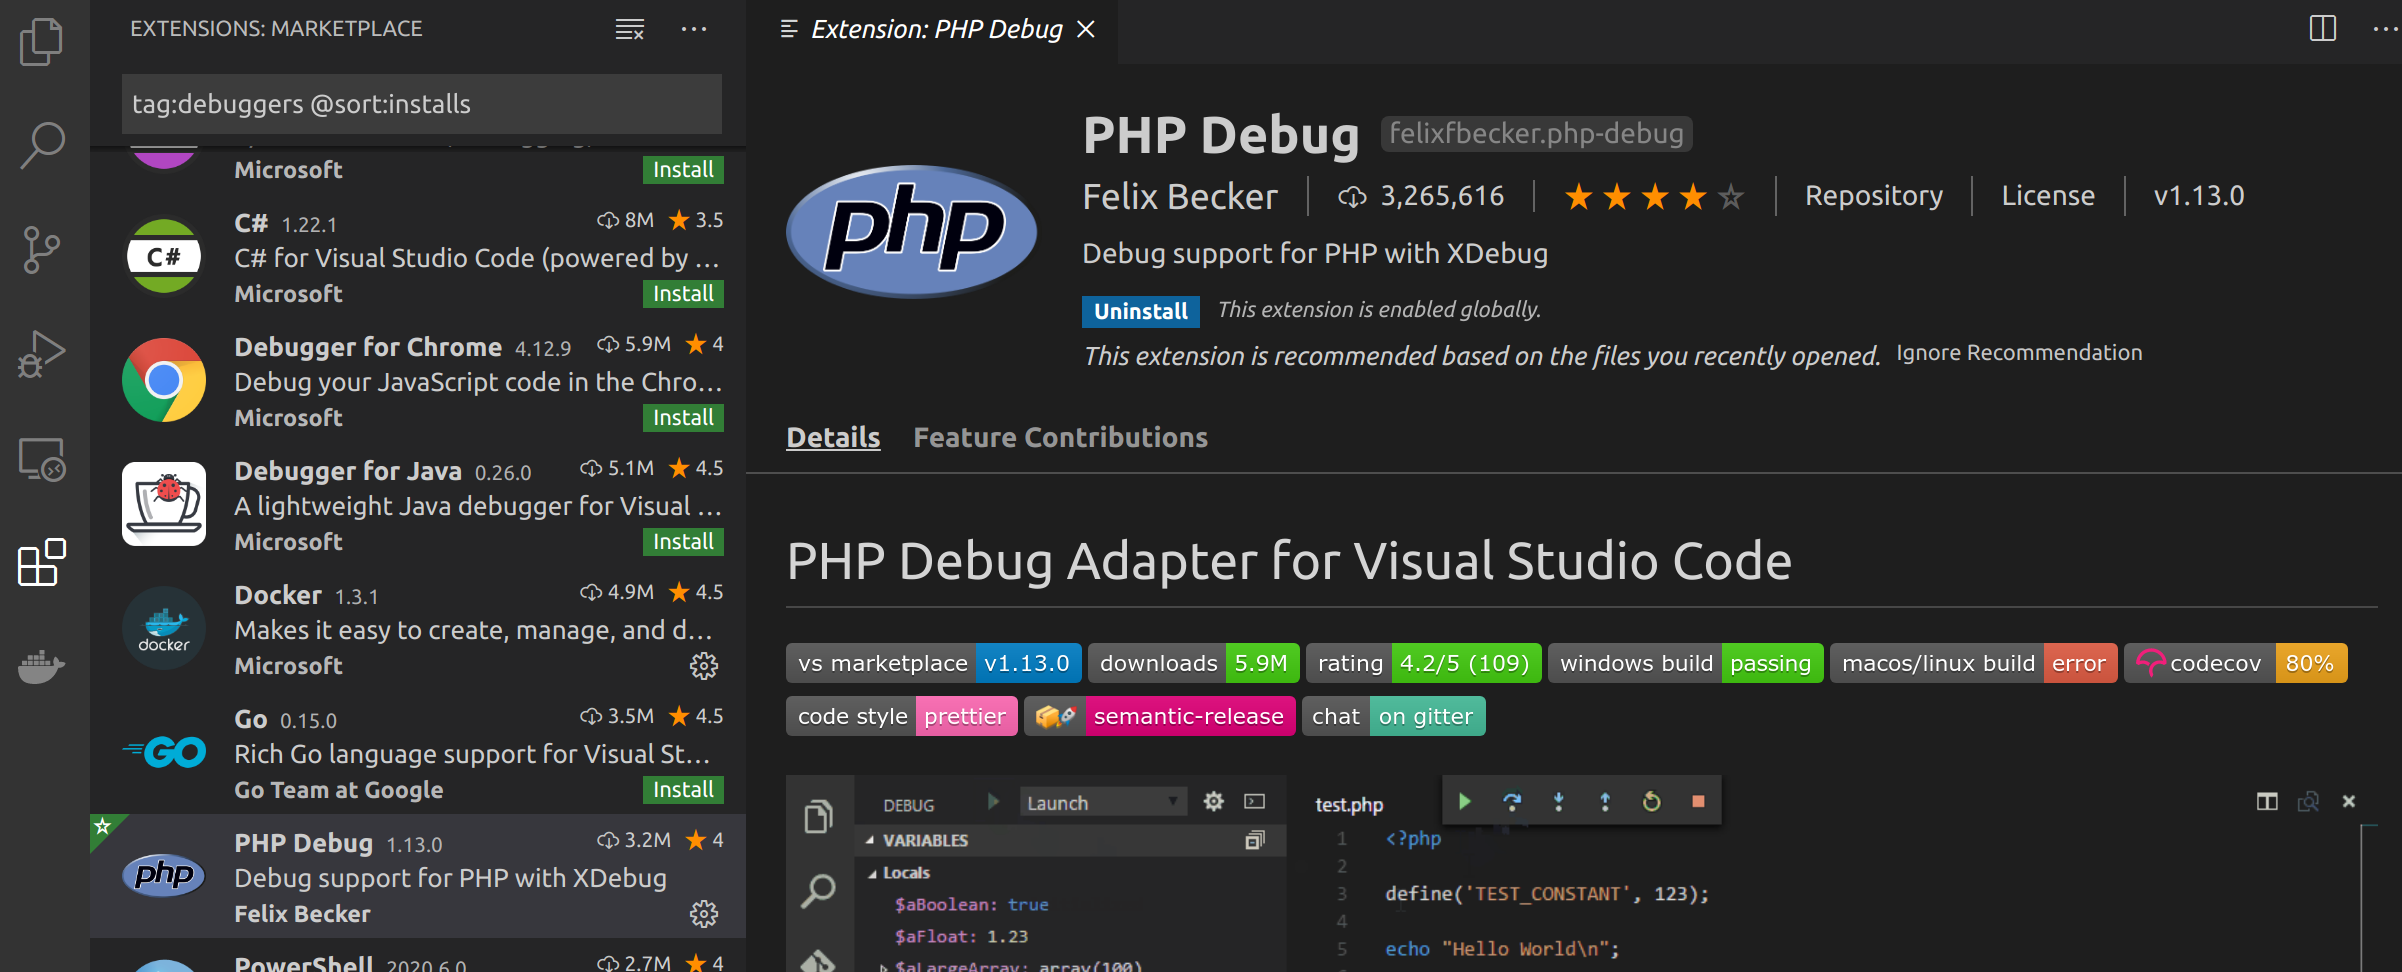
From the marketplace results that are presented, we want to install the PHP Debug extension.
Once installed, let’s return to the debug tag.
Click Create a launch.json file and select PHP. This will open a new launch.json file stored in the .vscode/ directory of the project.
Update the launch.json file to include pathMappings for your project. Mine are as follows.
{
    // Use IntelliSense to learn about possible attributes.
    // Hover to view descriptions of existing attributes.
    // For more information, visit: https://go.microsoft.com/fwlink/?linkid=830387
    "version": "0.2.0",
    "configurations": [
        {
            "name": "Listen for XDebug",
            "type": "php",
            "request": "launch",
            "port": 9000,
            "pathMappings": {
                "/app/my-app": "${workspaceRoot}/my-app"
            }
        }
    ]
}
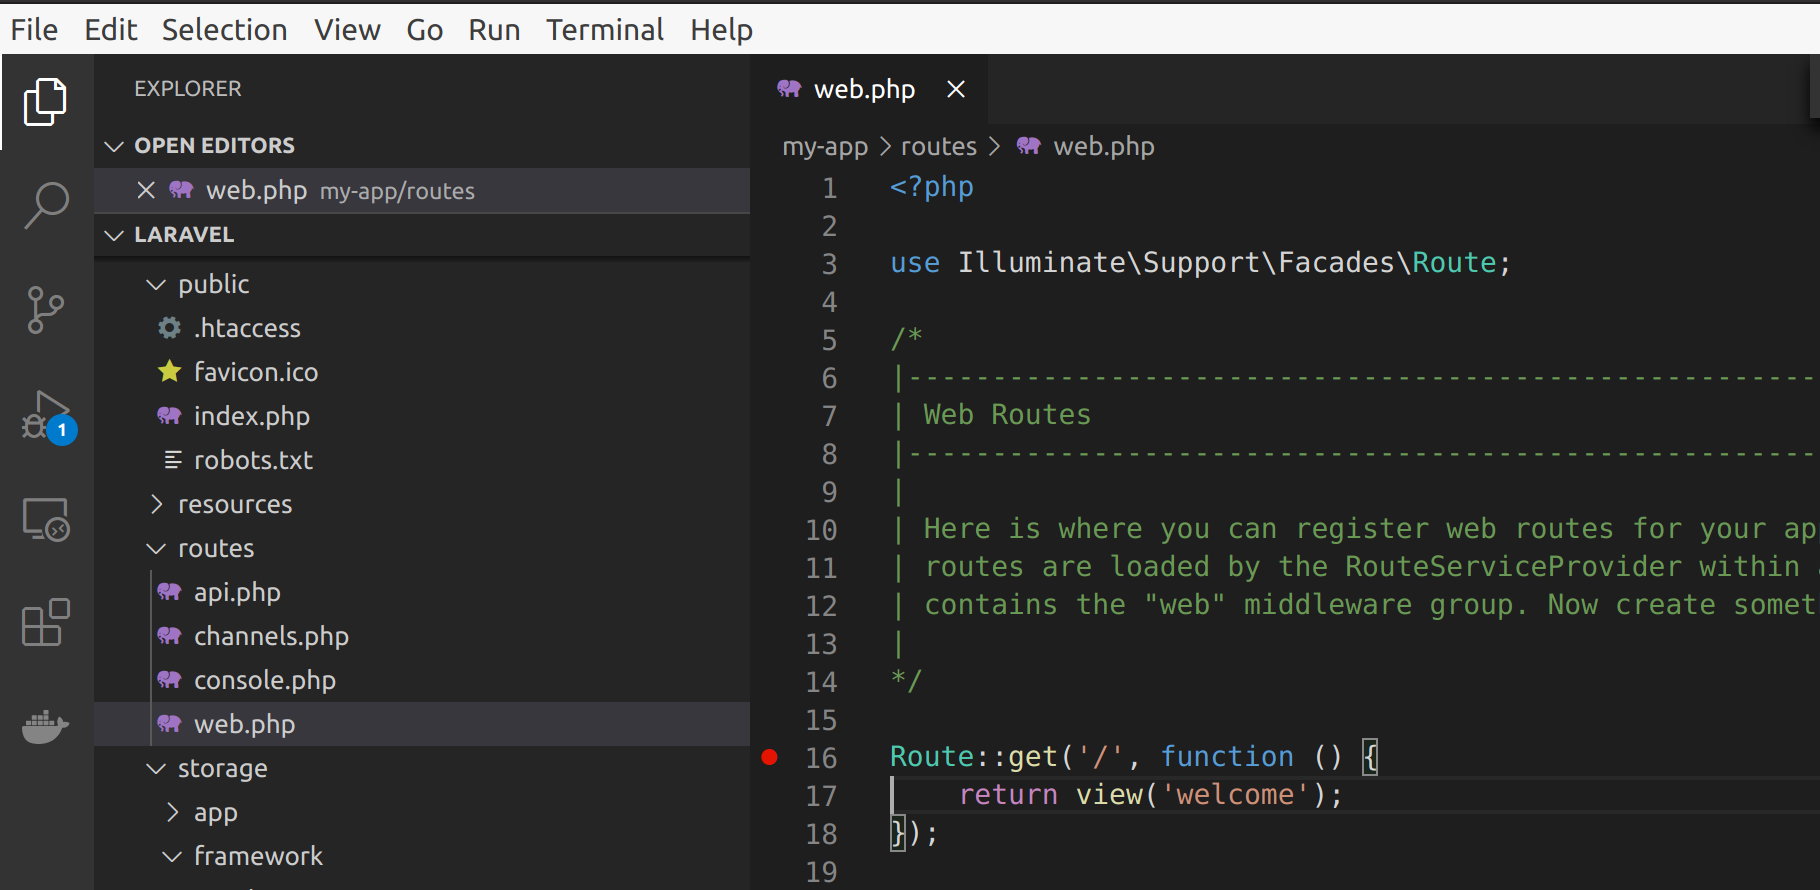
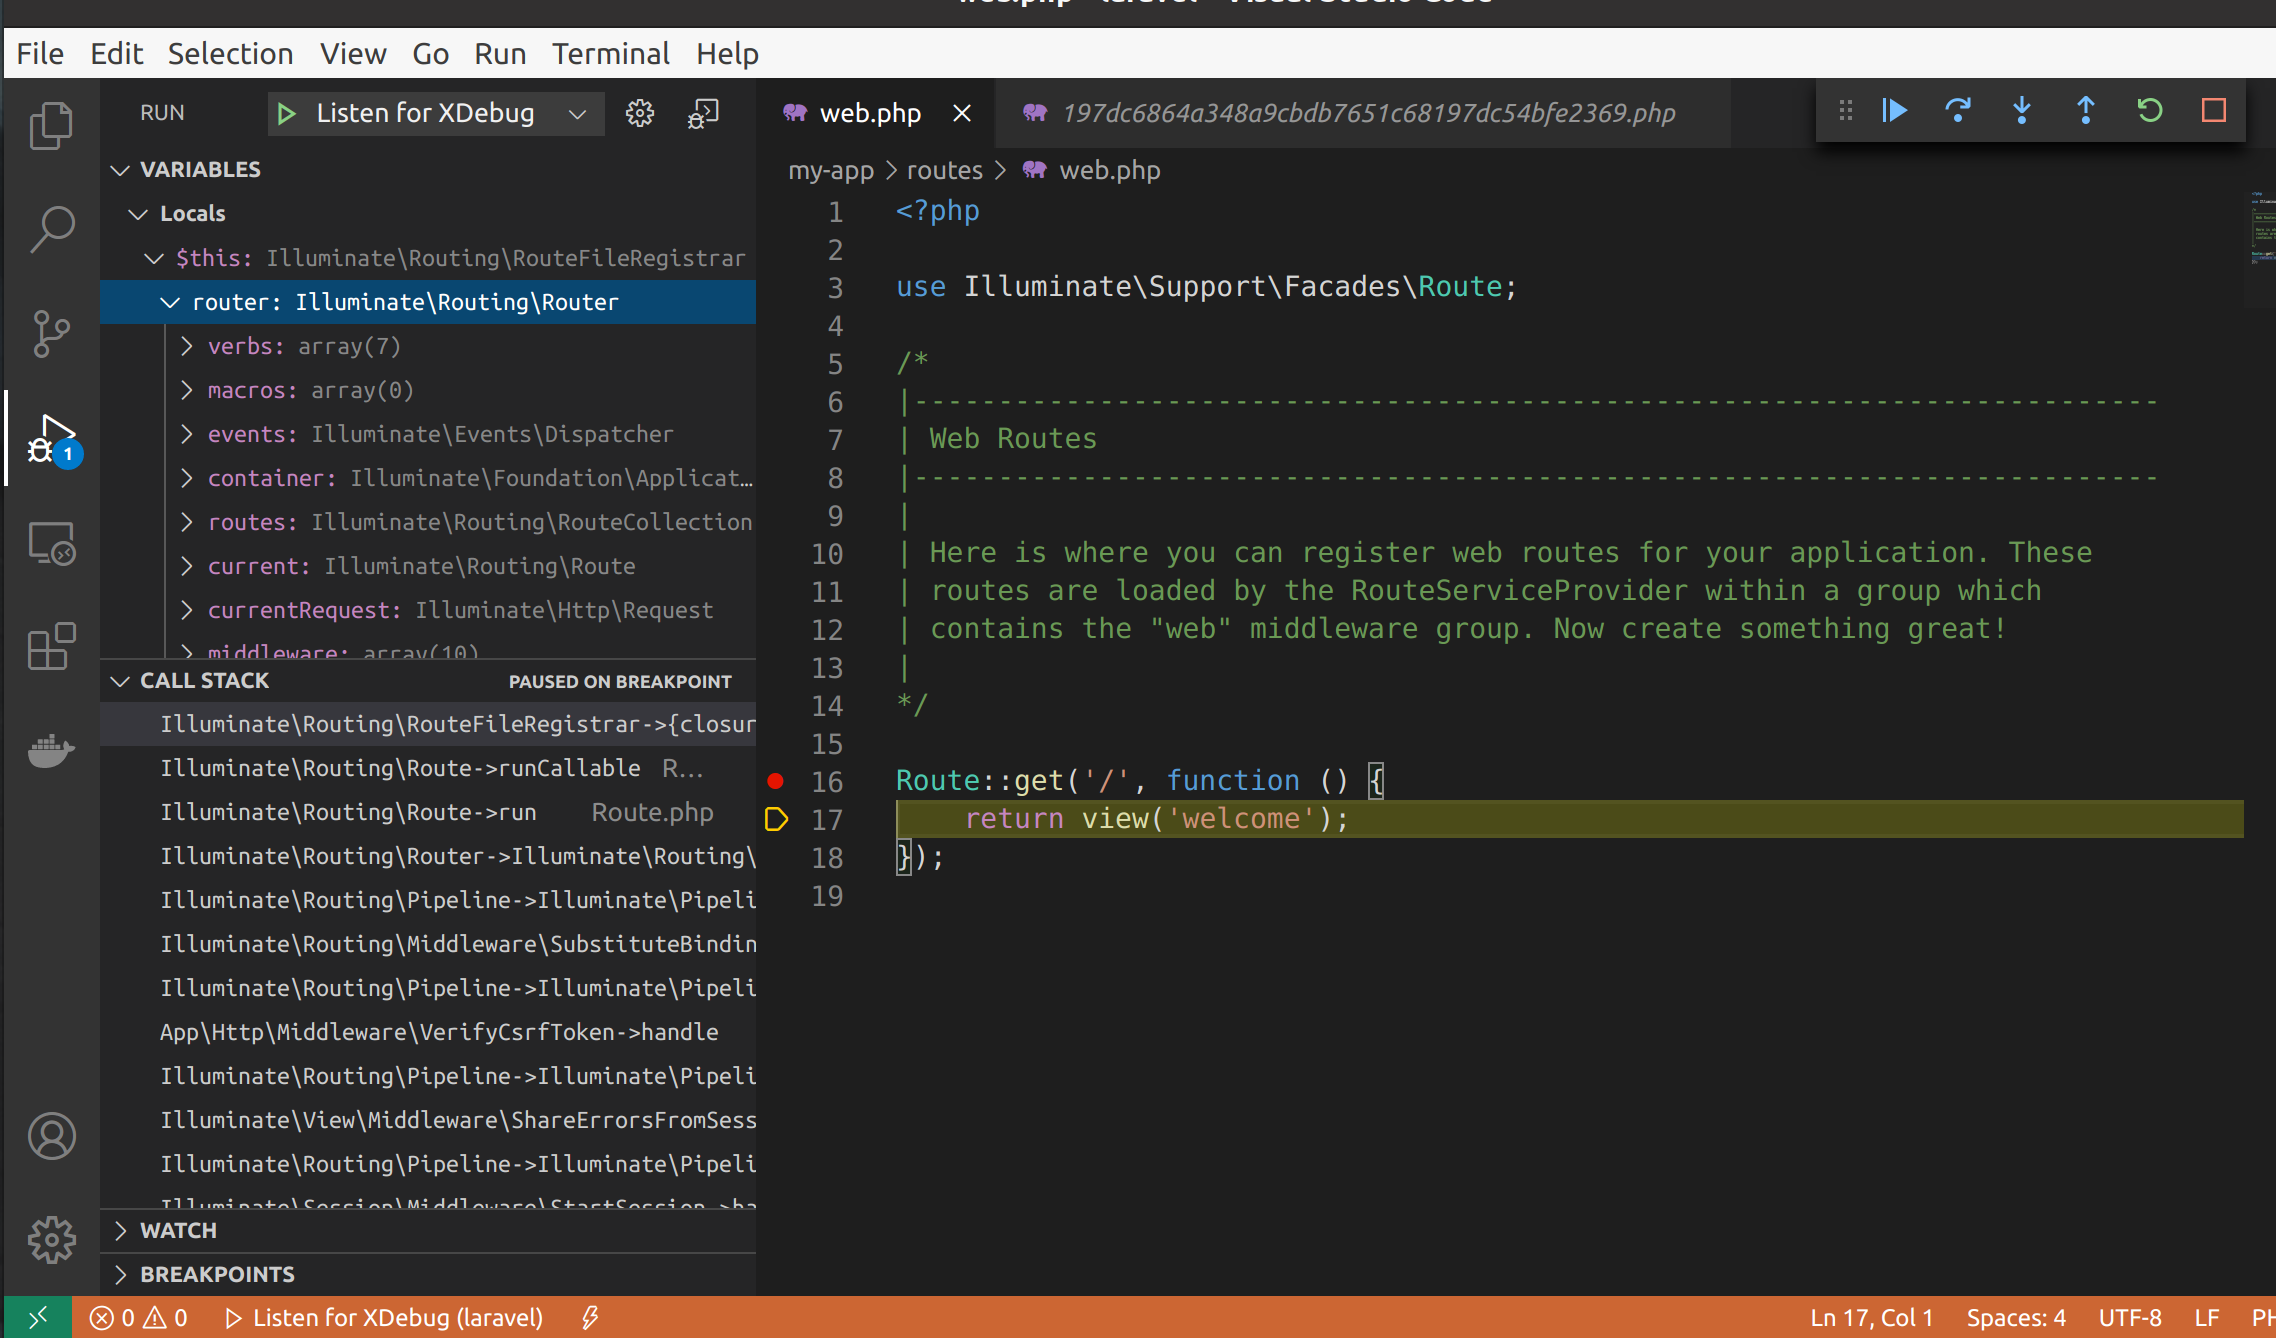
Again, we can open up our routes/web.php file and set a breakpoint by clicking to the left of the line of code.
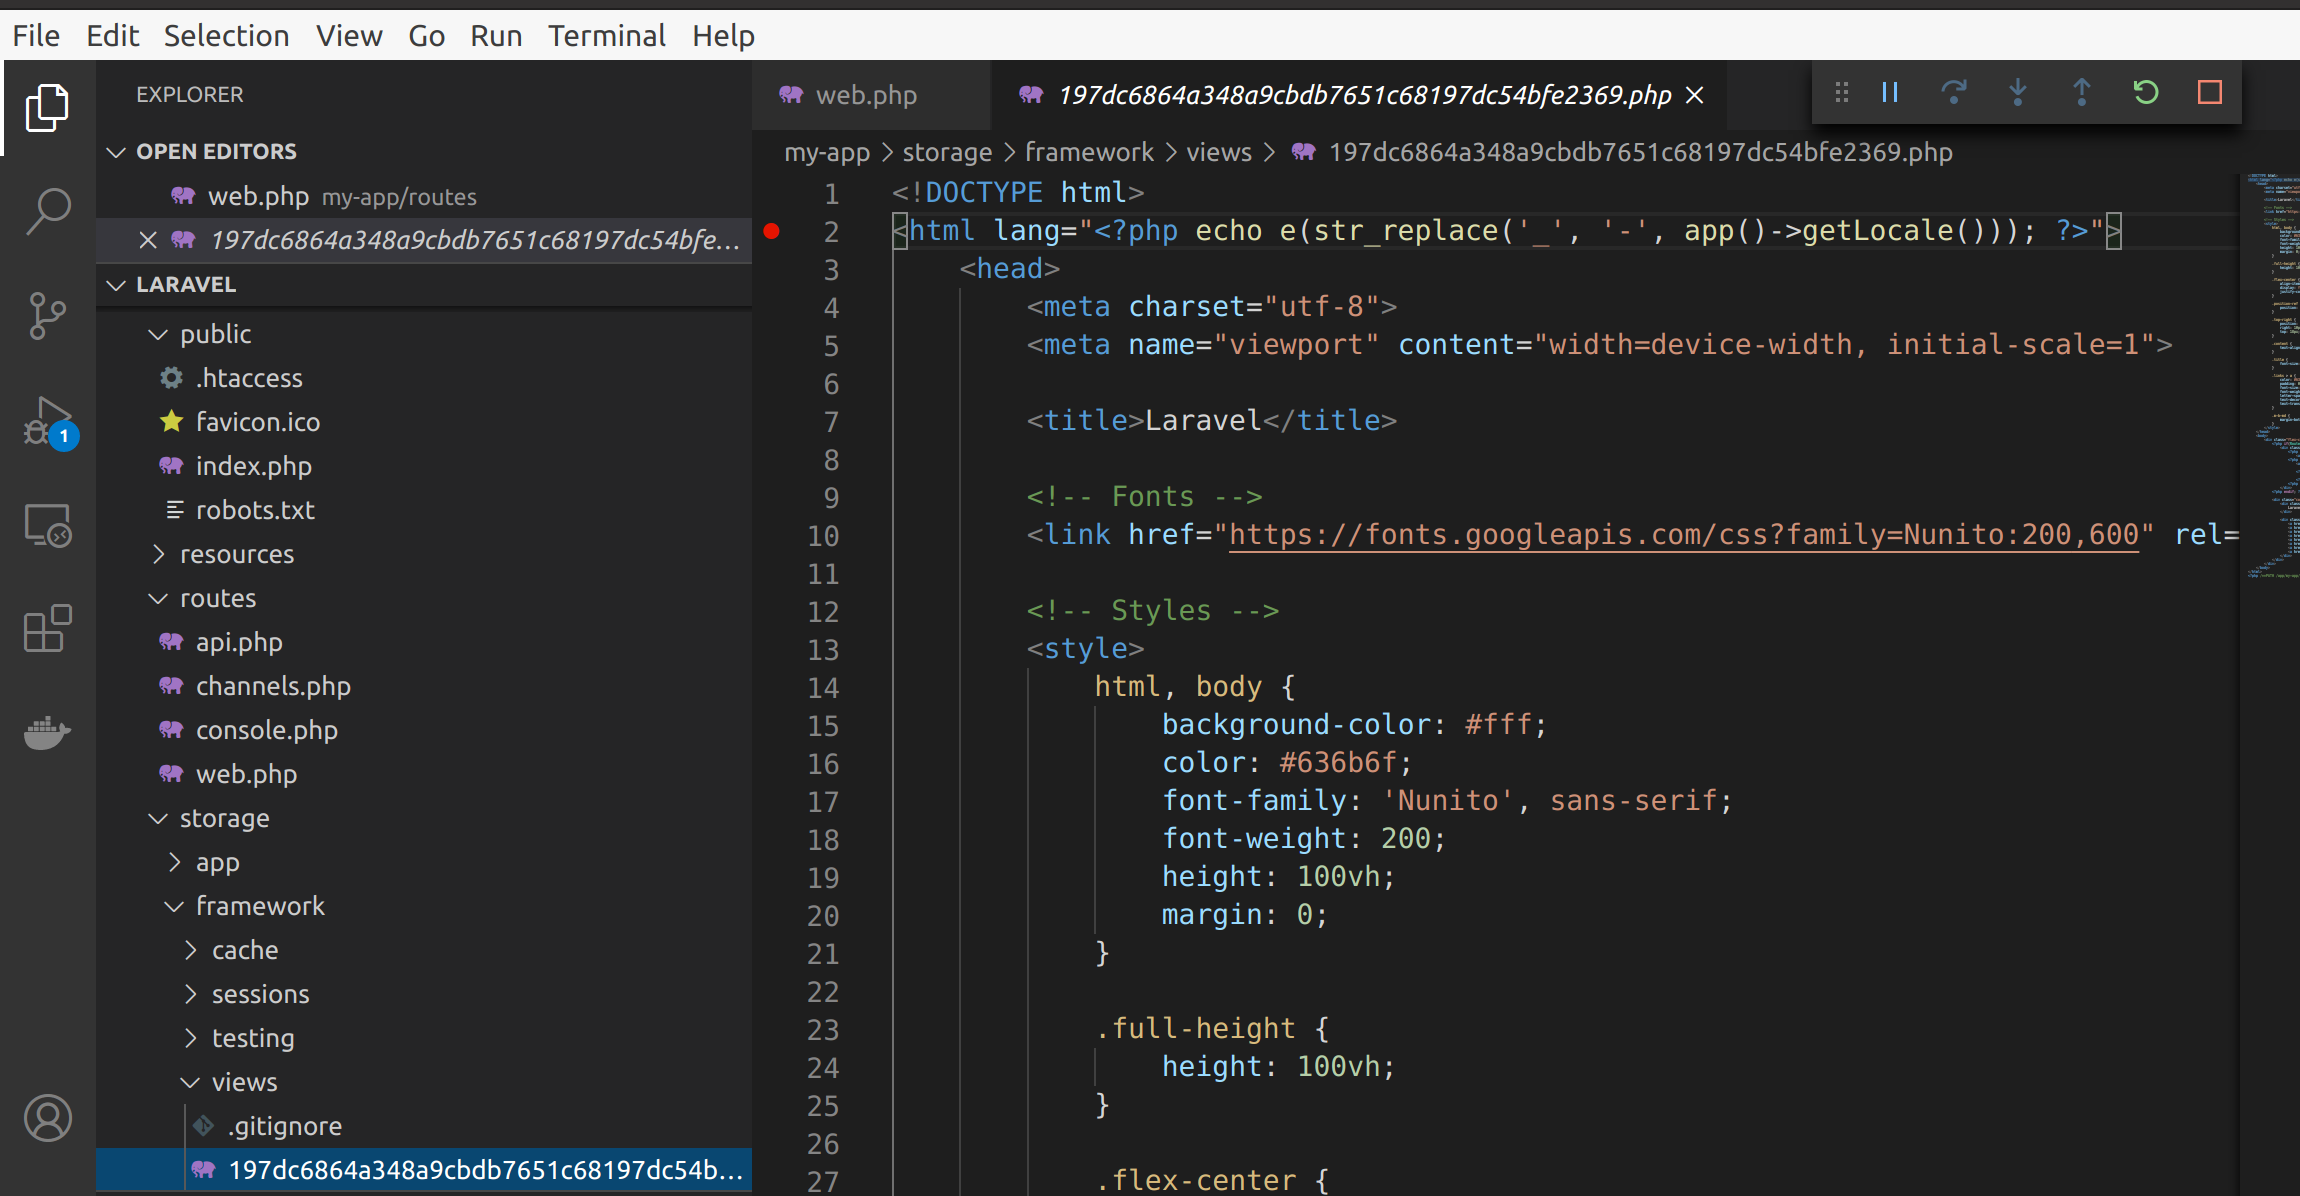
Here’s also in my compiled view
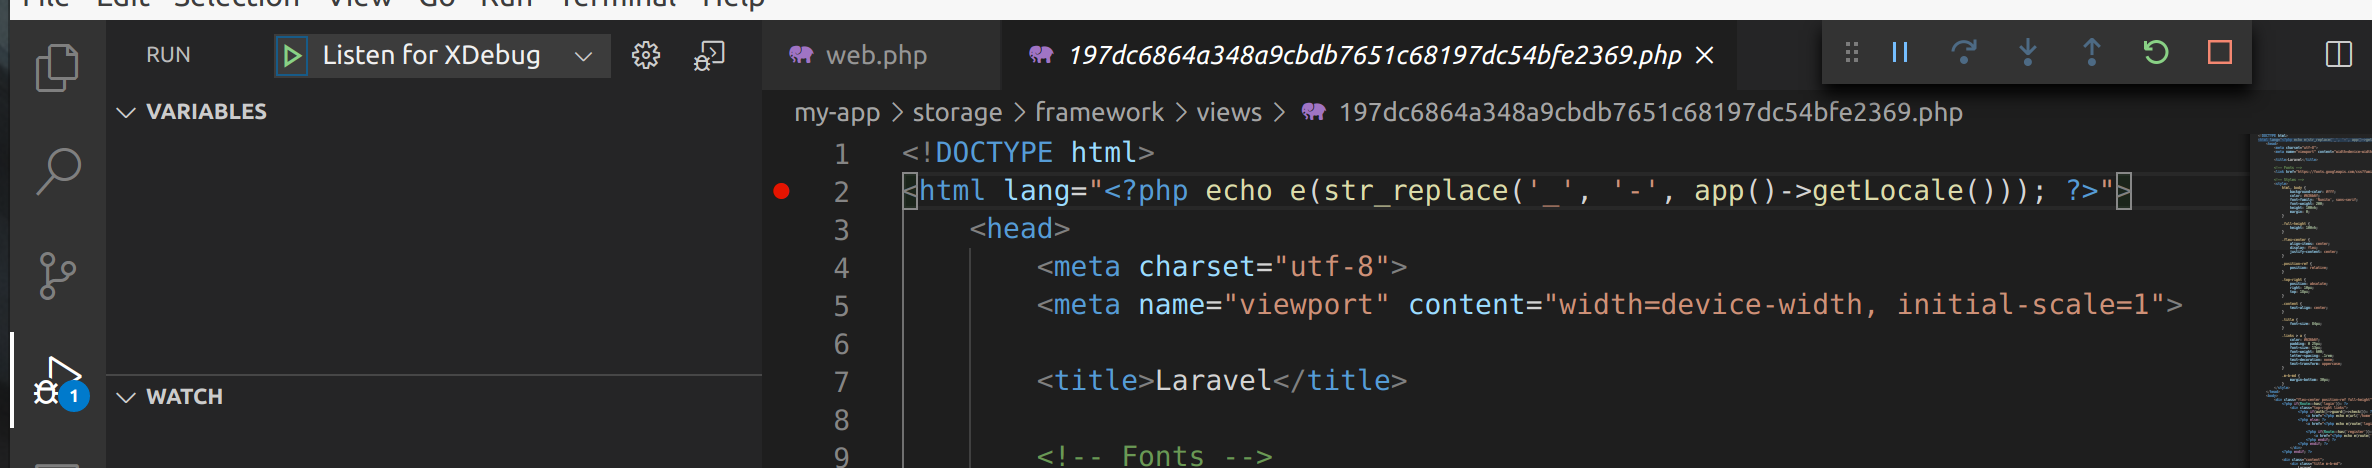
From the debug tag, click the Listen to XDebug play button, and the listening server should start up.
Reload the Laravel demo page once more, and the web.php breakpoint should trigger.
CLI Debugging
Here, we are lucky again. The existing launch.json and the PHP Xdebug settings will allow the cli commands to trigger our debugger.
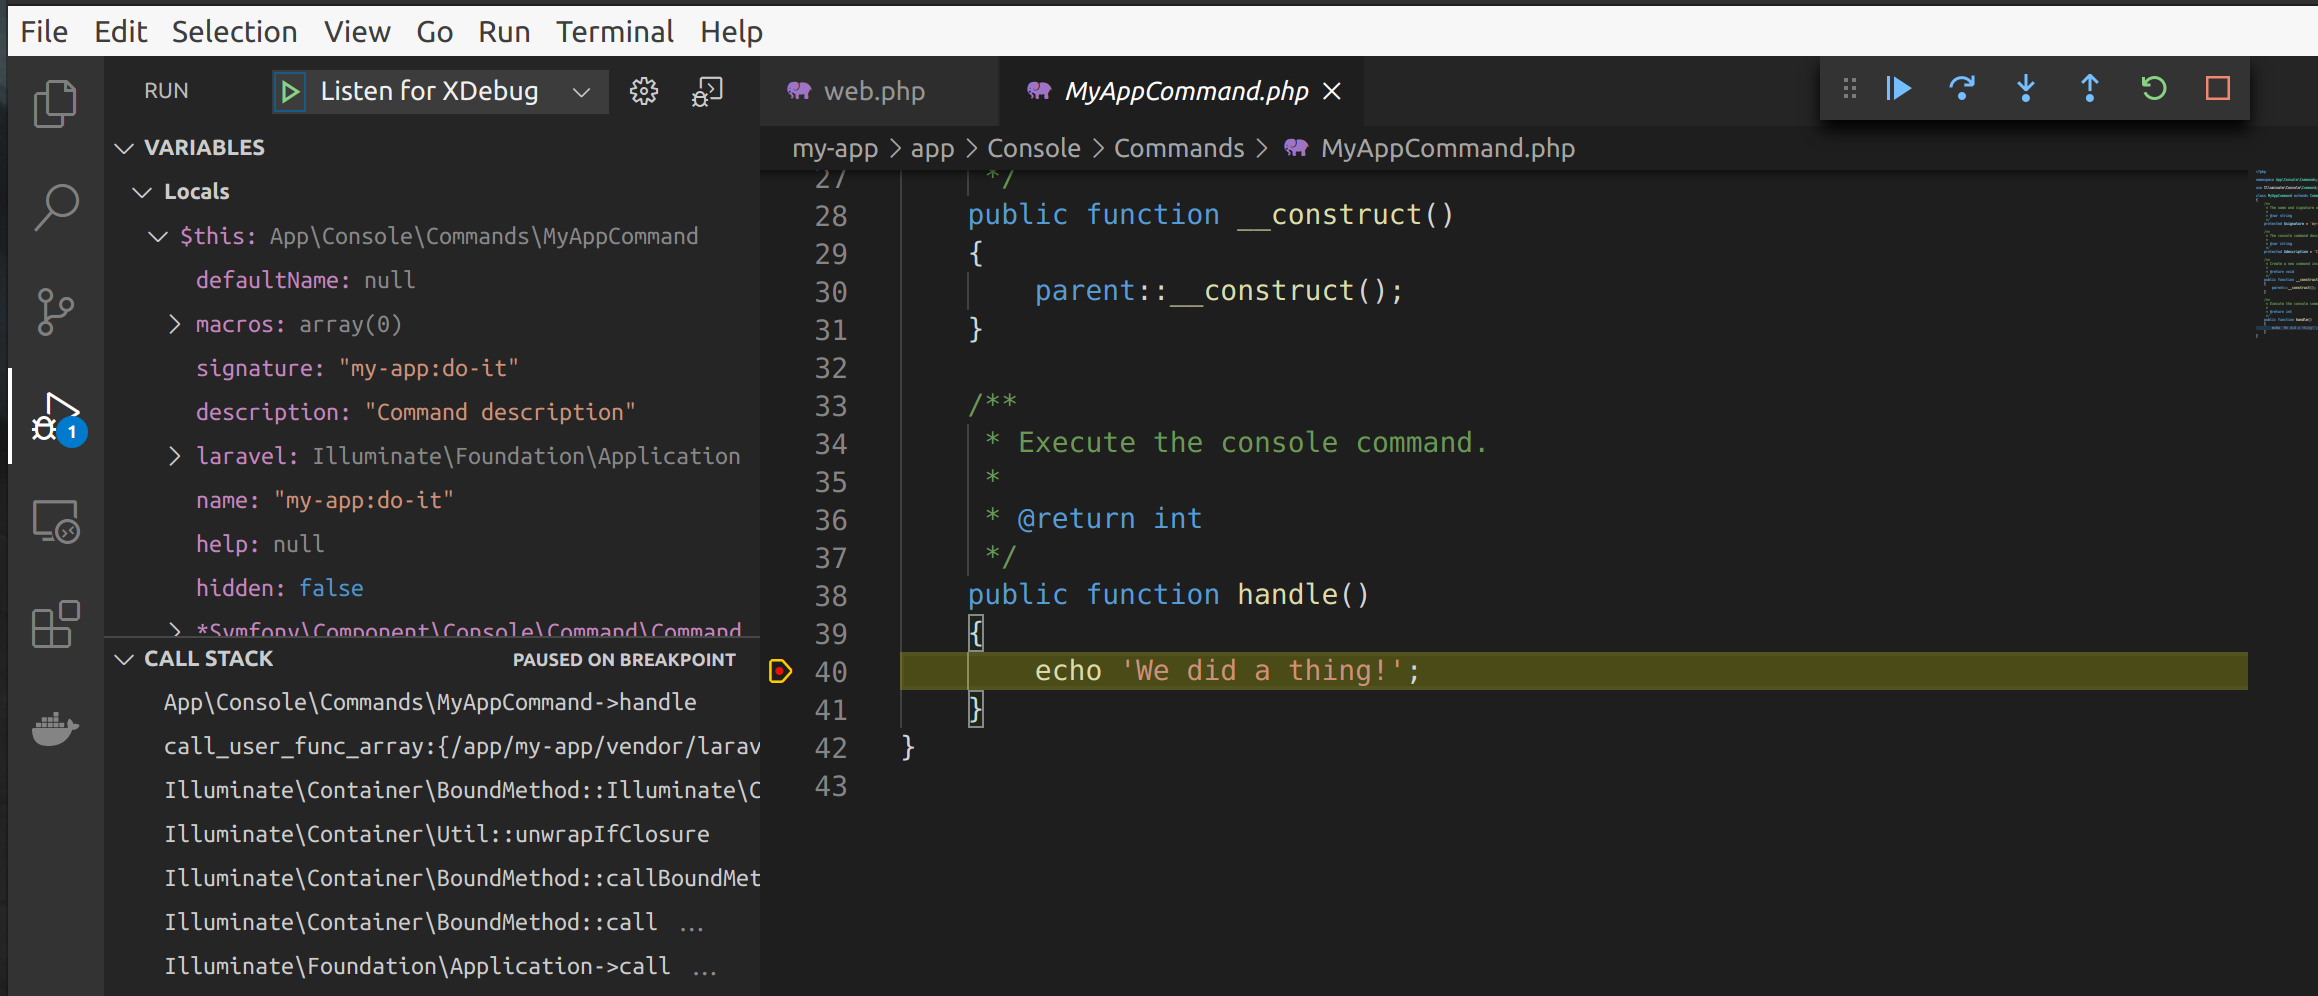
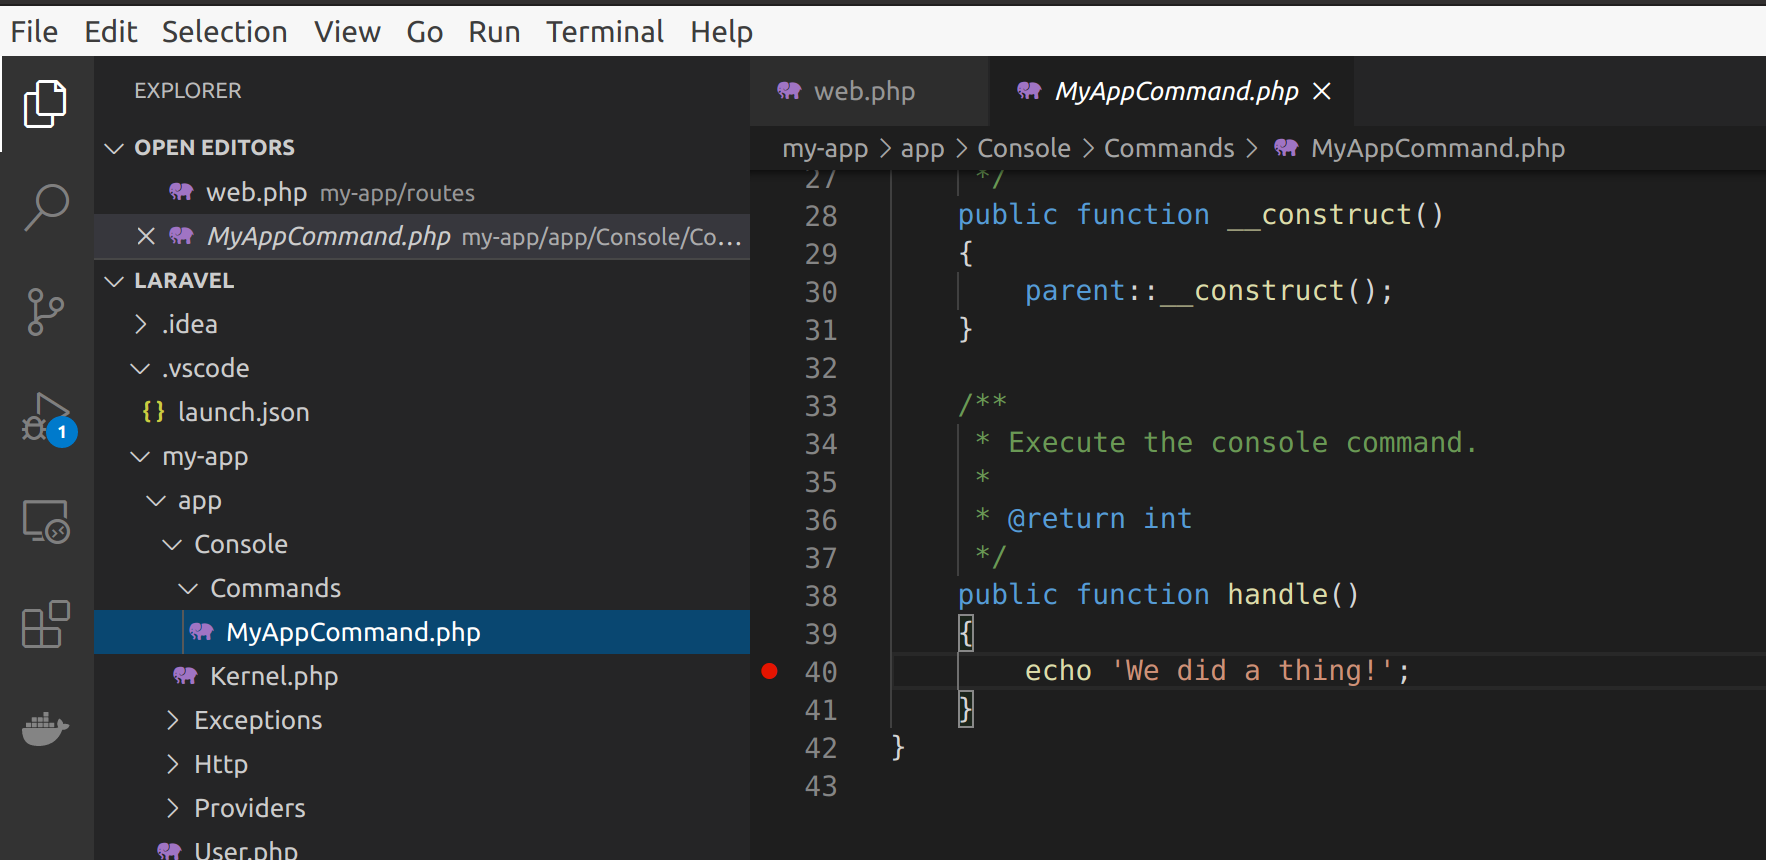
Let’s set a breakpoint in our console command.
And then move from our project root into the web root and then run our Laravel command via Lando.
cd my-app/
lando php artisan my-app:do-it
Our debugger should pop, and we can inspect the variables available at this point in our command execution.