Xdebug, PHPStorm CLI Interpreter, and Lando
One lesson I continue to learn is I should always fix my debugger. While Xdebug is hardly the only option to debug a php application, it’s my go to tool. I value all of the context it provides me, and if I need quick discovery code, I can shift to Tinkerwell, and hack away.
In my latest project, I wanted to finally try syncing my PHPStorm settings between my two workstations. In the process, I once again destroyed my Xdebug set up. Ive gotten used to the ebb and flow of my debugger working. While painful at first, setting Xdebug back up has become an art for me. Derek’s recent update to version 3.x has greatly improved the ease of set up, but nothing is ever always simple. With the commit of my .idea folder, I immediately found my setups broken.
As with earlier this month, I found myself reaching back to my own blog post on working with Xdebug, Lando, Laravel, and PHPStorm to address my cli commands (artisan some-command) and my HTTP requests from Insomnia. I thought I was ready to start debugging while running my PHPUnit tests. I thought wrong. The PHPStorm CLI Interpreter I had set could not find the Xdebug extension in the Docker container.
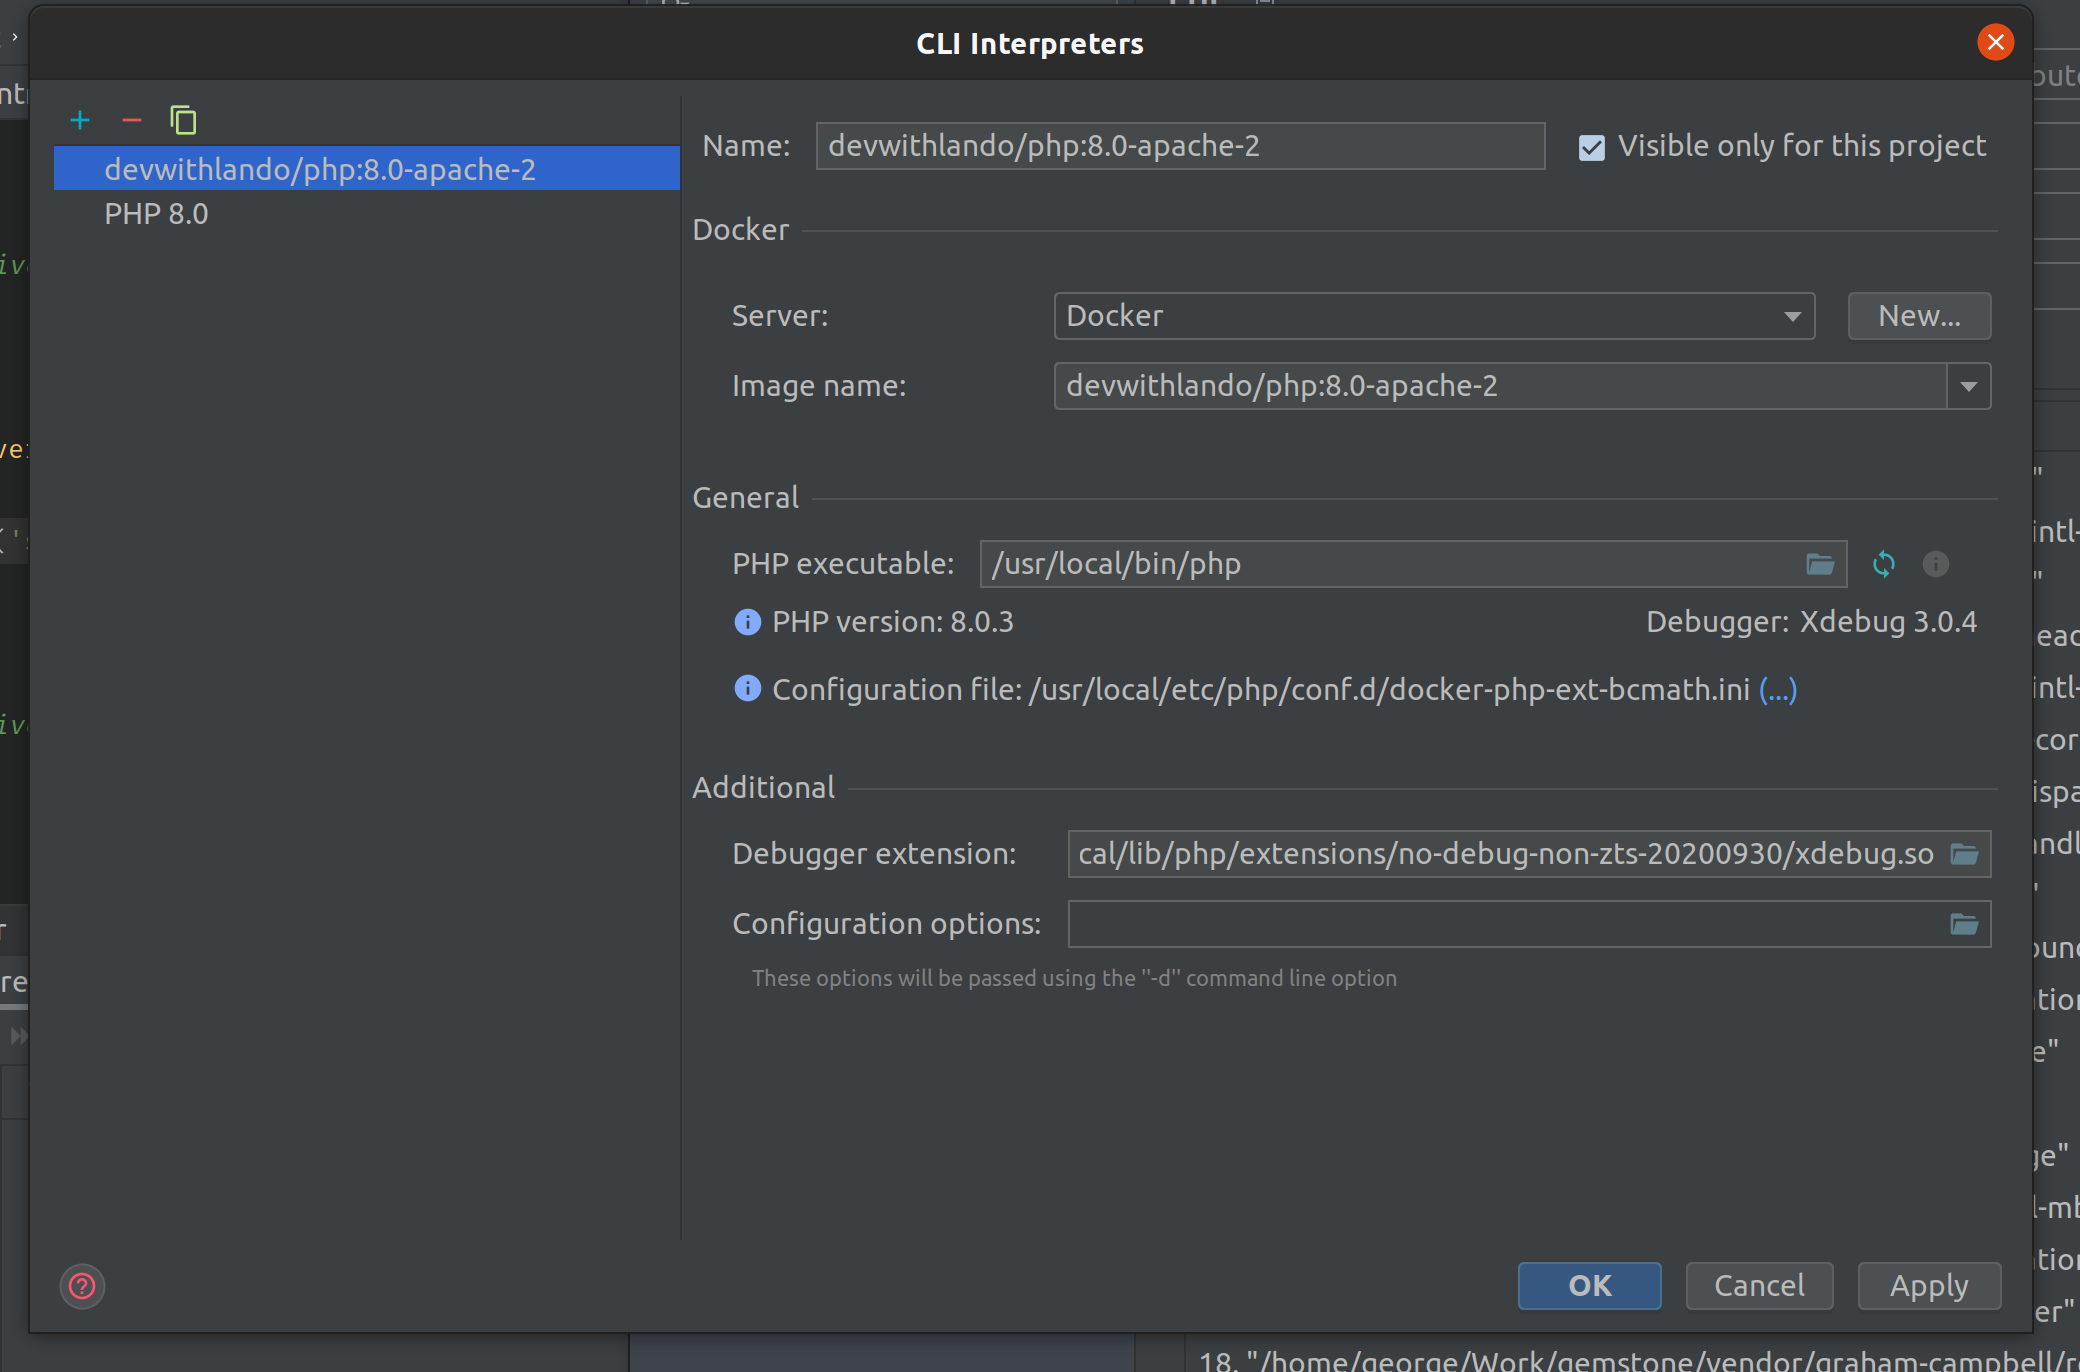
After some frustration, a night of sleep, and some early morning coffee, I was able to find that PHPStorm was starting a new instance of the image that Lando is set for the CLI Interpreter. From my discussions with Jetbrains support, this looks to be expected when not using traditional Docker Composer config files. I was able to dig up the actual Zend extension location by running an arbitraty PHP file in with the PHPStorm “Run…” options using a sleep statement in the file, and then using docker exec -it containerName /bin/sh and searching for the file. Once I had my Xdebug extension location, I was able to add that to the CLI Interpreter Additional Configuration Debugger Extension field. Finally back to business.